
DiaSorin, week 8: price stalls after the 1.4% dip
DiaSorin slips 1.4%, boxed in between support and resistance
DiaSorin, week 8: price stalls after the 1.4% dip
Our view last week
DiaSorin is in the 7th week of an open buy, with signal strength down to 44 out of 100 and the setup quality indicator at 45 out of 100, in an ordinary phase. The stock ranks 40th among the 62 open buys for European-UK stocks. Price is squeezed between the 200-day moving average resistance and the daily pivot point support, both very close: a compression phase worth watching.
This week's summary
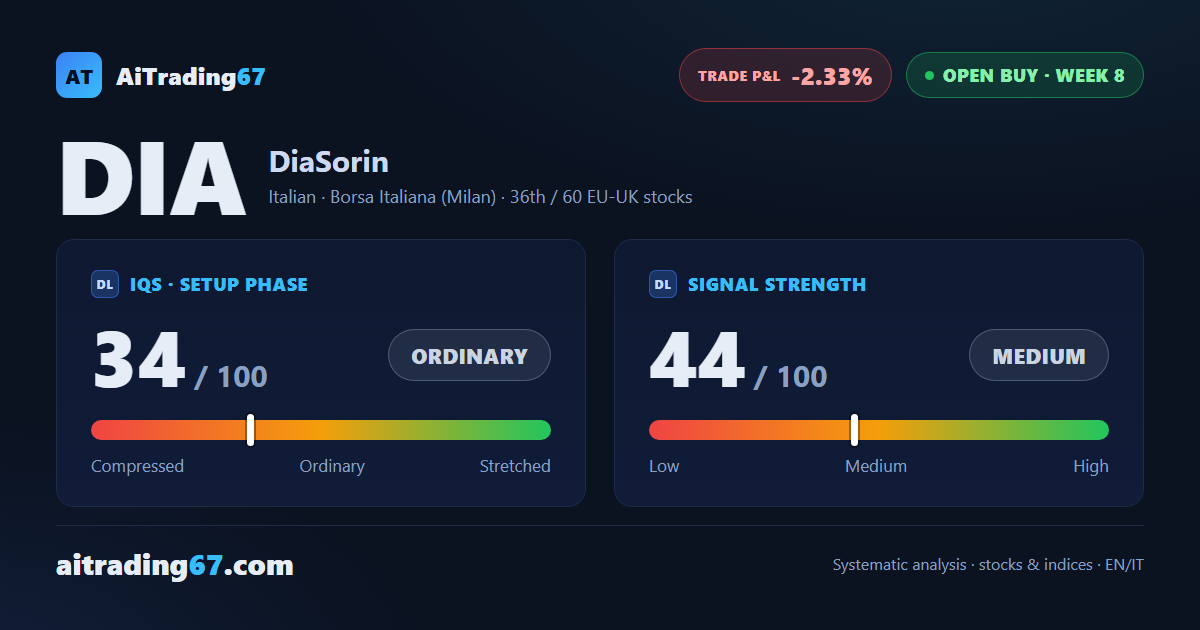
DiaSorin closed the week with a modest 1.4% loss, and buyers are running out of steam: the candle body is thinning and buyer dominance is fading, our weekly technical analysis shows. Price is boxed into a tight range between the 20-day moving average support, in the 68 area, and the daily pivot resistance, in the 69.4 area. The buy signal is in its 8th week, with signal strength down to 44 out of 100 and the second trimming window already reached.
IQS Phase
34
ordinary
Signal Strength
44
medium · weak
Sizing
REDUCED
Ranking
#36 / 60
EU-UK stocks in progress
Trade P&L %
-2.33%
from signal to today
restricted Platinum content