
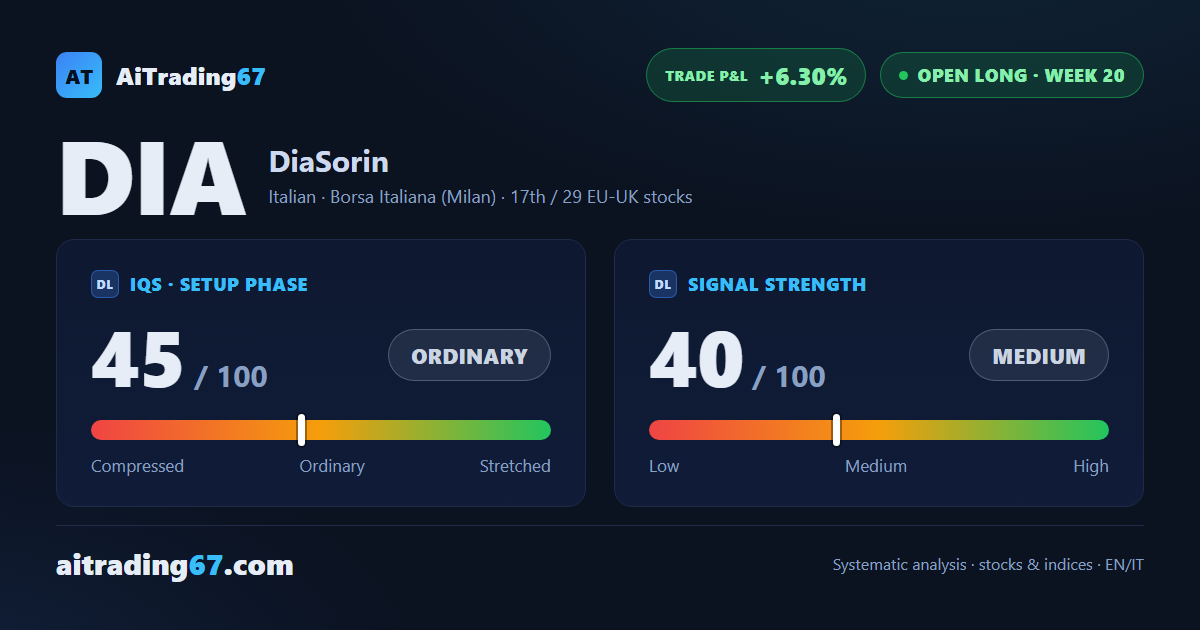
Open long · week 20
DiaSorin drops 4.9% as the 100-week average turns the price back in the 79 area
Our view last week
DiaSorin stock posts a second straight weekly gain, up 2.8%, with 79% of volume on the buy side: the highest share of the month, after 65% a week earlier. Money flow keeps rising and the weekly MACD extends above its Signal line. This technical analysis finds price pressed against the 100-week moving average, in the 79 area, where the price action has to confirm the push. The trade is up 11.8% since opening.
This week's summary
The 100-week moving average, in the 79 area, turned the price back: after 2 weeks of gains DiaSorin stock fell 4.9%. That was the test flagged 7 days ago, and it wasn't passed. The technical analysis picture holds, though: the weekly MACD stays above its Signal line, money flow rises for a 3rd week and daily price action finds footing on the 50-day average. For swing trading, the weekly buy signal stays live, with the trade up 6.3%.
IQS Phase
45
ordinary
Signal Strength
40
medium · weak
Sizing
REDUCED
Ranking
#17 / 29
EU-UK stocks in progress
Trade P&L %
+6.30%
from signal to date, no stop loss
DiaSorin (DIA) weekly chart — EMA50 · MACD · VWAP
Weekly chart · EMA50 · MACD · VWAP · Source: TradingView
Rank position
ranks 17th among the 29 Longs already running for European-UK stocks in our ranking, with a signal strength of 40 out of 100.
Sector context
SectorItalian
Benchmark ETFEXV4
Sector regimeweak phase
Performanceweekly -2.52% · monthly -5.64%
DIA belongs to the italian sector (reference ETF EXV4). The sector is classified weak phase according to our weekly reading.
restricted Platinum content