
Disney bounces 2.1% but the sell signal holds ground
Disney climbs 2.1%, yet money flow keeps confirming the sell signal
Disney bounces 2.1% but the sell signal holds ground
Our view last week
Walt Disney shed 3.9% this week, with 82% of volume on the sell side: after three weeks of doubt, the Sell signal has finally been confirmed. The weekly MACD has just crossed bearish and the price is back testing closely the double bottom in the 95 area, which had already produced a 5% rebound. The short is up 4.4%; the decline, though, still runs on low energy, with the ADX flat below 12.
This week's summary
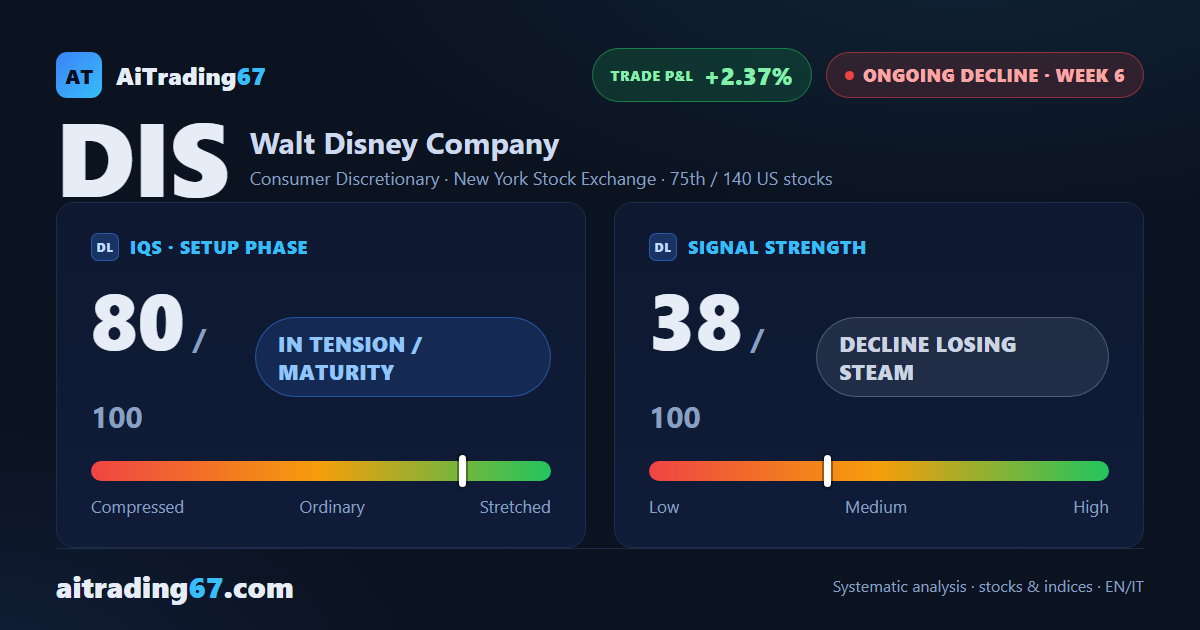
Disney bounces 2.1% this week, after last week's 3.9% drop that confirmed the sell signal. But under the surface nothing has really improved: money flow keeps worsening, momentum is accelerating lower, and the price action shows an ongoing distribution phase. The stock is still boxed in near the double bottom in the 95 area, with the ADX flat below 12 — this technical analysis points to a low-energy decline, not spent yet.
IQS Phase
80
in tension / maturity
Signal Strength
38
decline losing steam
Sizing
REDUCED
Ranking
#75 / 140
US stocks
Trade P&L %
+2.37%
from signal to today
restricted Platinum content