
US dividend ETF · Sell signal, week 4
DGRO slips 1.0% in a 7th straight losing week and prints a new 30-day low
Our view last week
For DGRO, the iShares US dividend growth ETF, this is a 6th straight losing week: the 0.4% slip is small, and the daily chart shows 3 lower highs, from the 80 area down to the 77 area. This DGRO technical analysis also tracks a sharp slowdown in the sell signal: a week ago its strength sat near the top of the scale, now it reads as a decline losing steam. The price action stays bearish, sellers still lead the weekly bar, and money flow is negative but turning up: a trade setup to watch.
This week's summary
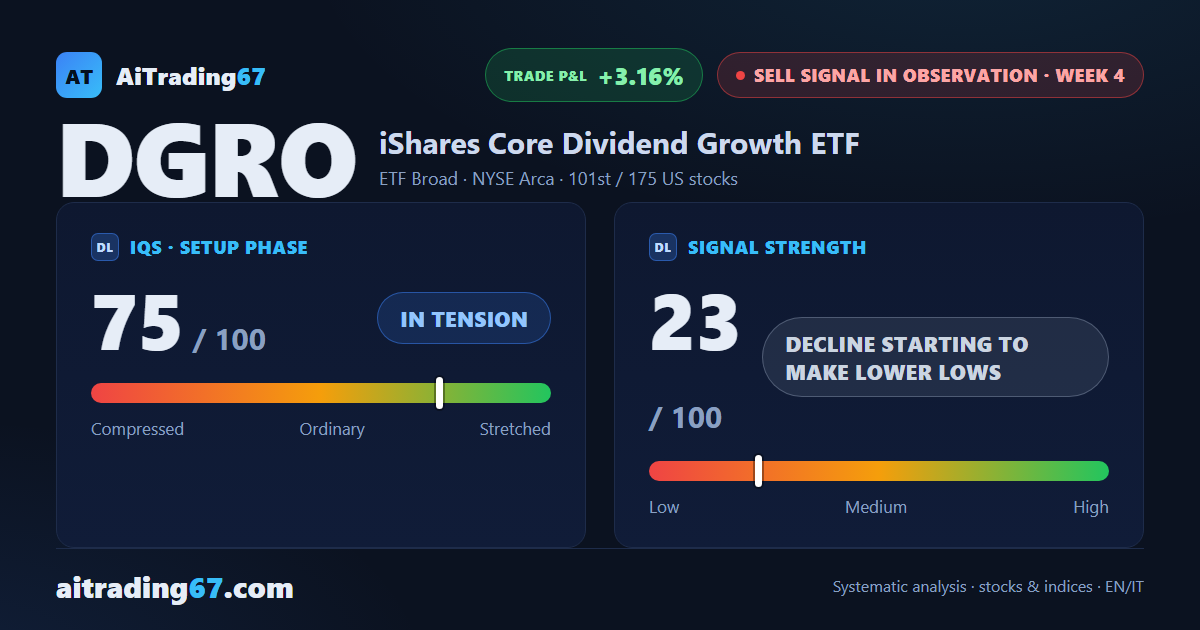
A new 30-day low for DGRO, the iShares dividend growth ETF: the week gives up 1.0%, its 7th straight loss, and the daily chart now counts 4 lower highs, from 79 down to 76. A week ago the decline looked out of fresh push; this DGRO technical analysis finds it picking up pace again, with price action still bearish and money flow negative. The sell signal stays under observation: a trade setup for swing trading to follow without hurry.
IQS Phase
75
in tension
Signal Strength
23
decline starting to make lower lows
Sizing
MINIMUM
Ranking
#101 / 175
US stocks sell signals
Trade P&L %
+3.16%
from signal to date, no stop loss
Dividend Growth (DGRO) weekly chart — EMA50 · MACD · VWAP
Weekly chart · EMA50 · MACD · VWAP · Source: TradingView
Rank position
ranks 101st among the 175 sell signals for US stocks in our ranking, with a signal strength of 23 out of 100.
Sector context
SectorETF Broad
Benchmark ETF—
Sector regime
Performanceweekly coming soon · monthly coming soon
DGRO belongs to the etf broad sector (reference ETF ).
restricted Platinum content