
CAC 40 ETF · Sell signal, week 7
DX2G drops 2.2% and loses its 100-week average, with a new 90-day low
Our view last week
After 6 straight weekly losses, DX2G, the Xtrackers CAC 40 ETF, closed slightly higher, up 0.4%: a pause with no buyers behind it, since sellers still took 86% of volume in the weekly bar and money flow keeps sinking. DX2G technical analysis shows bearish price action, with price squeezed between the daily Inversion Point average, in the 82.3 area, and the 7-day low, in the 81.8 area. The short stays 4.8% in profit, a trade setup for swing trading to follow week by week.
This week's summary
Last week's pause did not last: DX2G, the Xtrackers CAC 40 ETF, fell 2.2%, lost its 100-week average, in the 82 area, and set a new 90-day low. DX2G technical analysis shows bearish price action, with the weekly MACD below zero and money flow negative for 8 weeks. On the daily chart an RSI at 32 leaves room for a technical bounce. The short is 6.9% in profit, a trade setup for swing trading to follow week by week.
IQS Phase
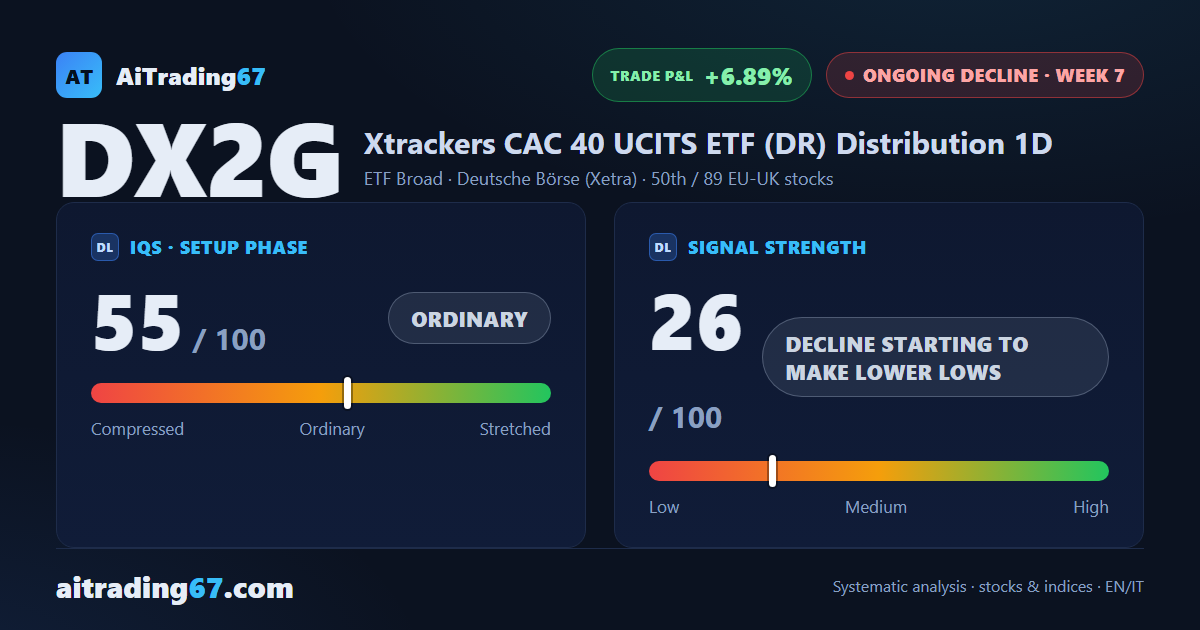
55
ordinary
Signal Strength
26
decline starting to make lower lows
Sizing
MINIMUM
Ranking
#50 / 89
EU-UK stocks
Trade P&L %
+6.89%
from signal to date, no stop loss
DX2G CAC 40 weekly chart — EMA50 · MACD · VWAP
Weekly chart · EMA50 · MACD · VWAP · Source: TradingView
Rank position
ranks 50th among the 89 sell signals for European-UK stocks in our ranking, with a signal strength of 26 out of 100.
Sector context
SectorETF Broad
Benchmark ETF—
Sector regime
Performanceweekly coming soon · monthly coming soon
DX2G belongs to the etf broad sector (reference ETF ).
restricted Platinum content