
Buy signal, fourth week: the base holds
Ecolab dips 0.5% as the double bottom repeats at a higher level
Buy signal, fourth week: the base holds
Our view last week
Ecolab gives back 3.2% this week: underneath the red candle, buyer dominance collapsed and sellers ruled the last bar to an extreme. The daily chart tells a different story, though, with a clean double bottom in the 251 area and a 5% intermediate rebound. In this week's technical analysis, the Buy signal is in its third week, with the trade still up 1.93% from entry.
This week's summary
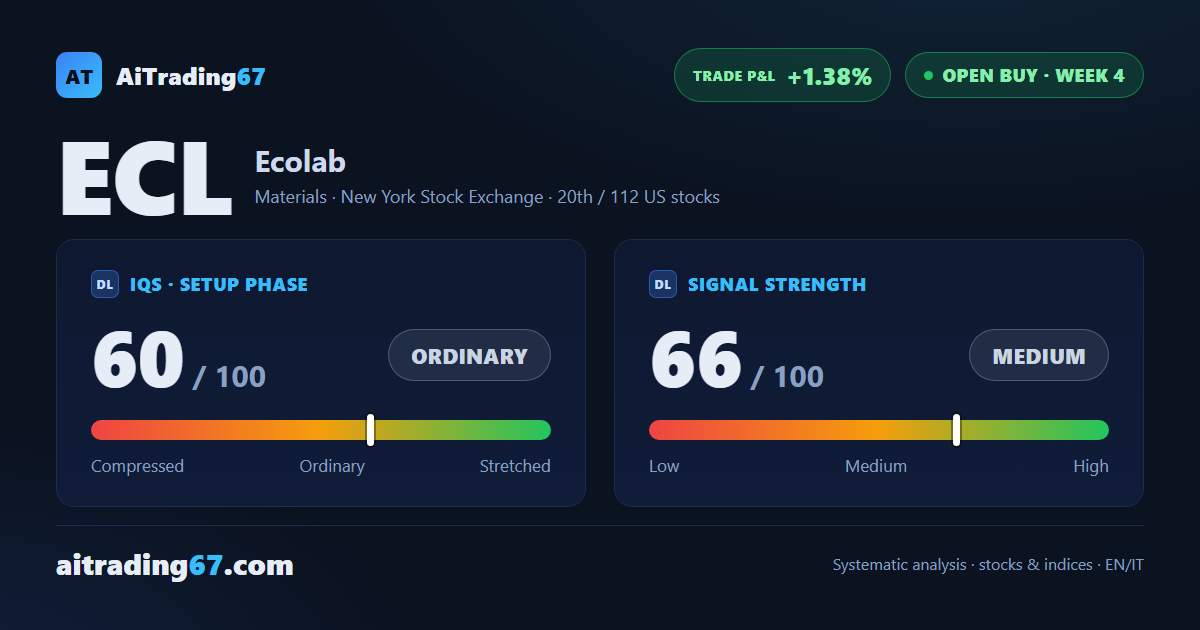
Ecolab stock barely moved this week (-0.5%): sellers took over the last bar and volumes contracted. On the daily chart, though, the stock repeated last week's pattern with a fresh double bottom, higher this time, in the 256 area, and a 4% rebound. The Buy signal is in its fourth week: in our weekly technical analysis, Ecolab ranks 20th among 112 open US Longs, with signal strength 66 out of 100.
IQS Phase
60
ordinary
Signal Strength
66
medium
Sizing
STANDARD
Ranking
#20 / 112
US stocks in progress
Trade P&L %
+1.38%
from signal to today
restricted Platinum content