Sell signal — week 7
Edison International: ongoing decline, but structure slowing
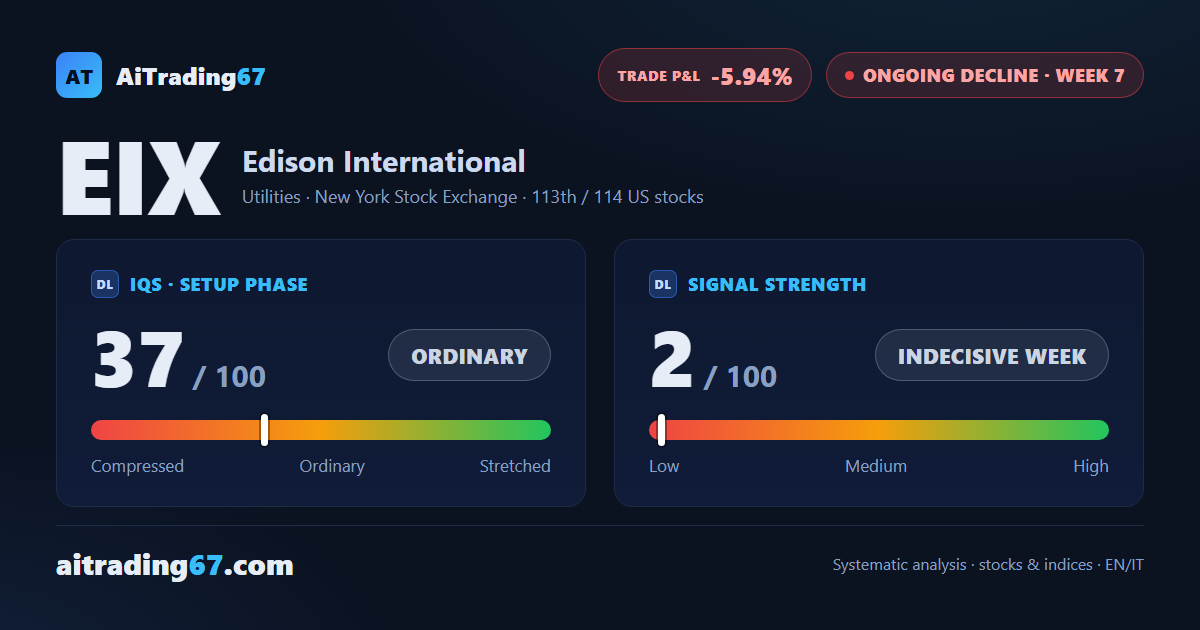
Sell signal — week 7
In Summary
At week 7 of the sell signal on Edison International, the decline continues but the technical picture over the last 4 weeks has lost coherence. The week closed with a minimal loss of 0.5% and buy volume at 78% — an unusual reading for a sell signal in continuation. A double bottom has formed in the 66 area on the daily chart, with a 10% intermediate rebound.
IQS Phase
37
ordinary
Signal Strength
2
indecisive week
Sizing
MINIMUM
Ranking
#113 / 114
US stocks
Trade P&L %
-5.94%
from signal to today
restricted Platinum content