EN IT

EssilorLuxottica: 27 weeks of decline, signal still active

EssilorLuxottica weekly technical analysis — week 27 of a sell signal, +38% trade performance. The latest week closed with strong selling pressure, but momentum indicators show a mixed picture with possible exhaustion building in the background.

EssilorLuxottica: 27 weeks of decline, signal still active
Sell signal · week 27
EssilorLuxottica: 27 weeks of decline, signal still active
June 19, 2026
Sell signal · week 27
In Summary
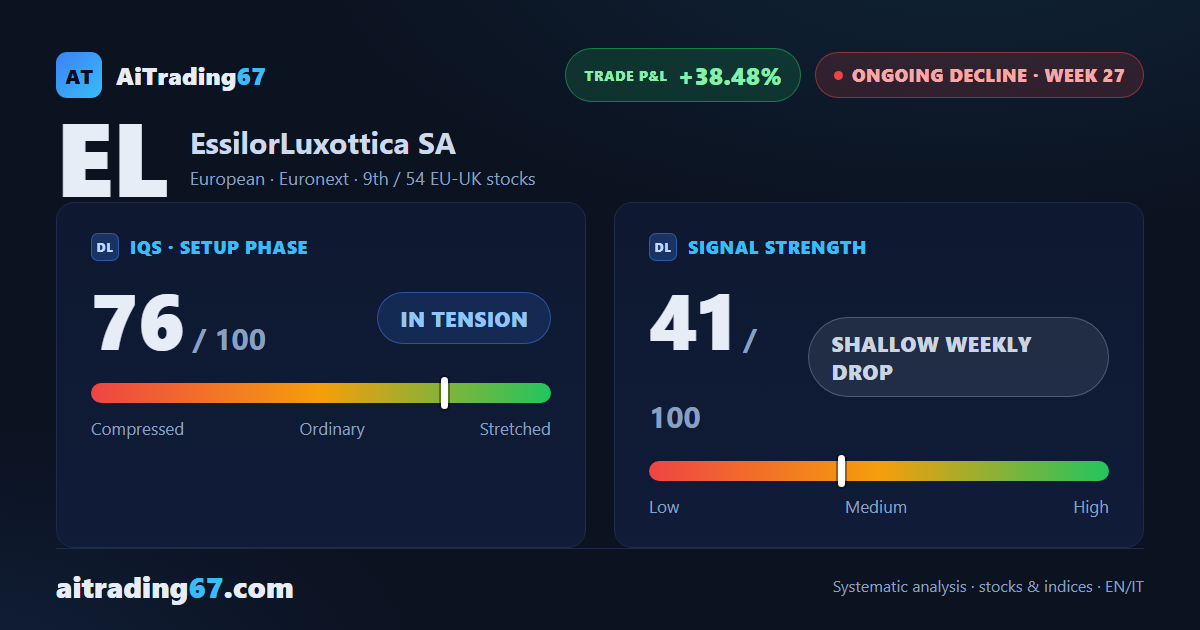
EssilorLuxottica is at week 27 of a sell signal, with a trade gain of 38% from inception. The latest week closed with a sharp 5% drop and 98% sell volume, but the technical picture over the past 4 weeks is more nuanced, with a daily double bottom in the 165 area and MACD momentum compressing toward zero.
Ongoing decline ·27th week from start ·EU-UK stocks ·T2 ★ See Gold version →
IQS Phase
76
in tension
Signal Strength
41
shallow weekly drop
Sizing
REDUCED
Ranking
#9 / 54
EU-UK stocks
Trade P&L %
+38.48%
from signal to today
Chart · Weekly — EMA50 · MACD · VWAP
Weekly chart · EMA50 · MACD · VWAP · Source: TradingView
How to read this pageA visual guide to the post, card by card
The full analysis, operating plan and detailed levels on this asset are reserved for clients ★ PLATINUM
restricted Platinum content
Share WhatsApp Telegram Gmail LinkedIn