
EN IT

EssilorLuxottica: the sell signal reaches week 30 with a double bottom in the 162 area

EssilorLuxottica weekly technical analysis at week 30 of a sell signal in management, with a double bottom in the 162 area and an 8% rebound. The technical picture shows a decline that holds but is losing some drive.

EssilorLuxottica: the sell signal reaches week 30 with a double bottom in the 162 area
EssilorLuxottica, week 30 of the decline
EssilorLuxottica: the sell signal reaches week 30 with a double bottom in the 162 area
July 03, 2026
EssilorLuxottica, week 30 of the decline
In Summary
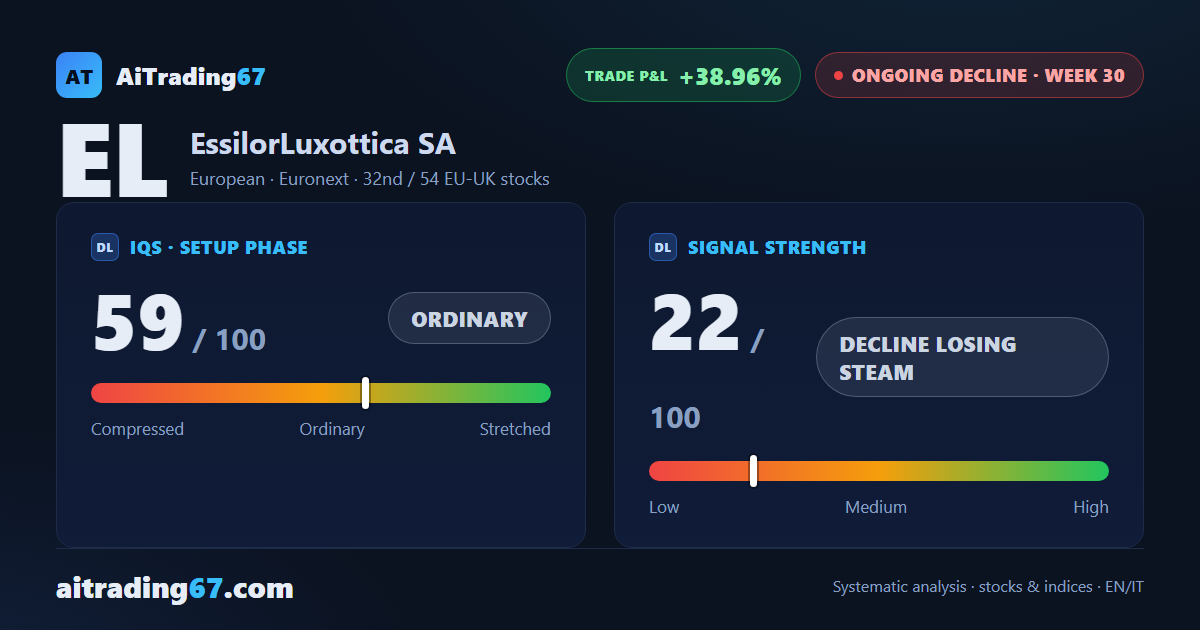
Week 30 of the sell signal on EssilorLuxottica, listed on Euronext, with the trade still up 39% since opening. A double bottom has formed on the daily chart in the 162 area, with an 8% intermediate rebound: a downward trend that holds on the directional front but has lost some of its drive in recent days.
Ongoing decline ·30th week from start ·EU-UK stocks ·T2 ·📅 Earnings · Jul 28 ★ See Gold version →
IQS Phase
59
ordinary
Signal Strength
22
decline losing steam
Sizing
MINIMUM
Ranking
#32 / 54
EU-UK stocks
Trade P&L %
+38.96%
from signal to today
Chart · Weekly — EMA50 · MACD · VWAP
Weekly chart · EMA50 · MACD · VWAP · Source: TradingView
How to read this pageA visual guide to the post, card by card
The full analysis, operating plan and detailed levels on this asset are reserved for clients ★ PLATINUM
restricted Platinum content
Share WhatsApp Telegram Gmail LinkedIn