
Sell under management · week 31
EssilorLuxottica slips 0.5% as the decline stays boxed between the 170 and 172 areas
Sell under management · week 31
Our view last week
Week 30 of the sell signal on EssilorLuxottica, listed on Euronext, with the trade still up 39% since opening. A double bottom has formed on the daily chart in the 162 area, with an 8% intermediate rebound: a downward trend that holds on the directional front but has lost some of its drive in recent days.
This week's summary
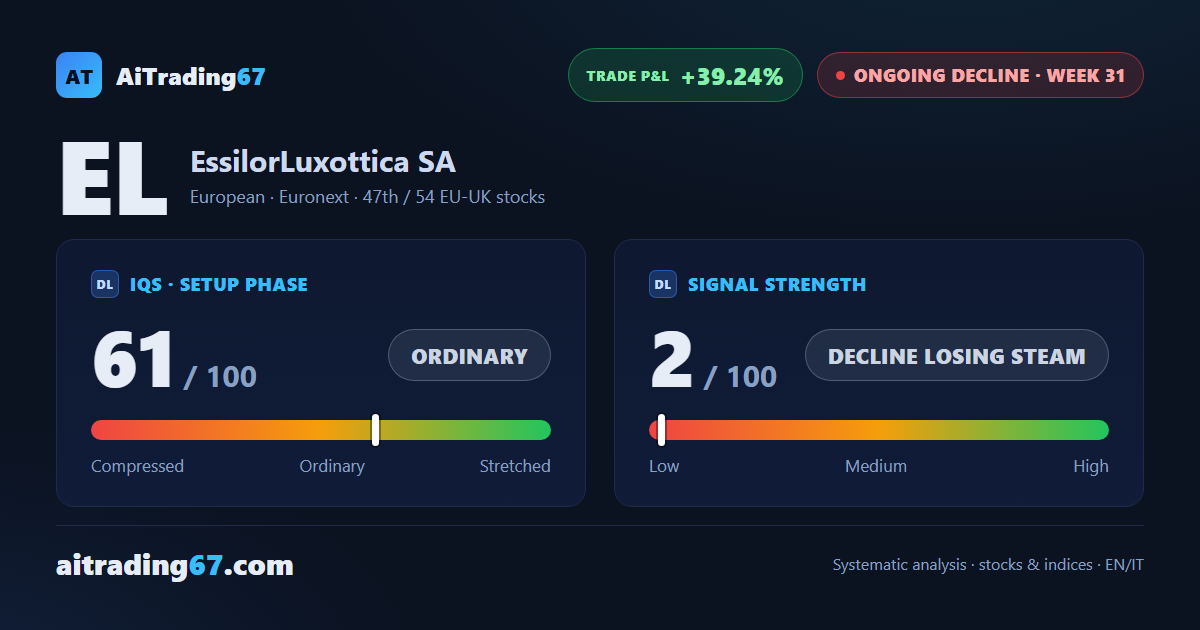
EssilorLuxottica shares stay boxed into a tight band between the 170 area and the 172 area, closing the week almost flat, -0.5%. This week's technical read confirms what showed up seven days ago: the sell signal still holds its direction but keeps losing fuel, with MACD, money flow and momentum all improving while sellers stay only marginally ahead of buyers. The short is running above 39% in profit.
IQS Phase
61
ordinary
Signal Strength
2
decline losing steam
Sizing
MINIMUM
Ranking
#47 / 54
EU-UK stocks
Trade P&L %
+39.24%
from signal to today
restricted Platinum content