
ENAV, week 2 of a Sell signal
ENAV slips 1.7% as the daily double bottom holds
ENAV, week 2 of a Sell signal
Our view last week
ENAV shares slip 2.9% this week as the picture flips: a fading buy signal gives way to a fresh Sell signal, ranking 4th of 54 among European-UK stocks. The daily chart tells a more nuanced story — a clean double bottom in the 5.0 area with a 6% bounce and volume entirely on the buy side — while the stock is still 20.8% above its 200-week average: opening a short here is high-risk per our model.
This week's summary
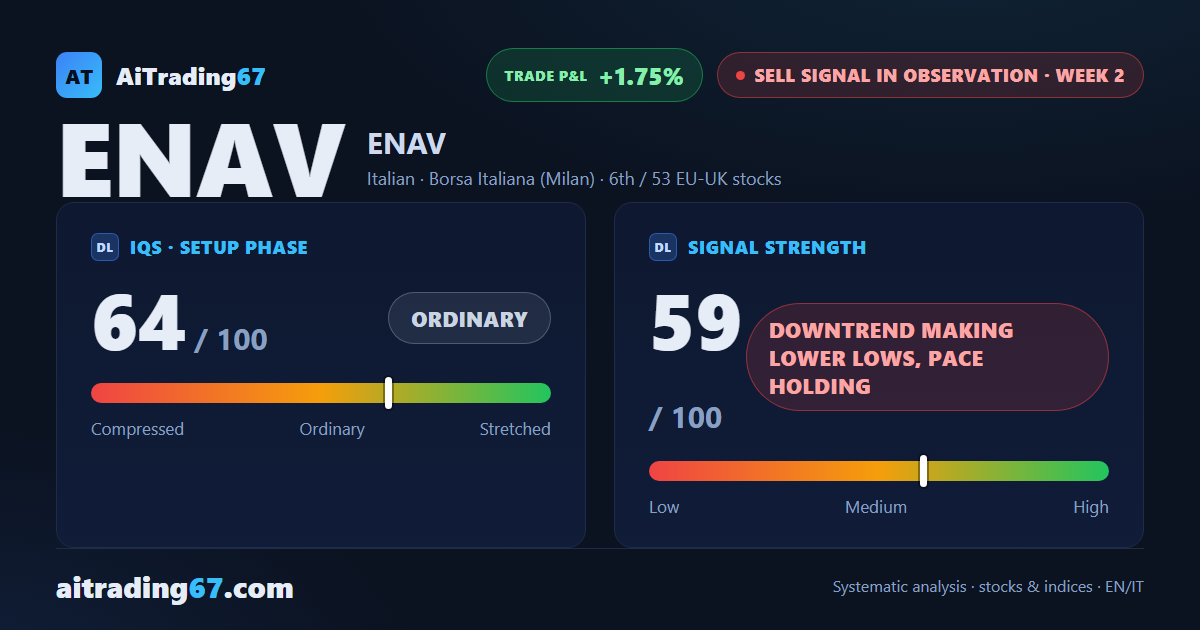
ENAV shares slip 1.7% this week, but the daily chart is forming a double bottom in the 5.0 area with a moderate 4% rebound. The Sell signal is still healthy though: signal strength reads 59 out of 100, "downtrend making lower lows, pace holding," and ENAV ranks 6th among the 53 European-UK sell signals. The quality band flags trading as not recommended for anyone looking to open now.
Sell signal in observation
·2nd week from start
·EU-UK stocks
·T2
·📅 Earnings · Aug 3
★ See Gold version →
IQS Phase
64
ordinary
Signal Strength
59
downtrend making lower lows, pace holding
Sizing
STANDARD
Ranking
#6 / 53
EU-UK stocks sell signals
Trade P&L %
+1.75%
from signal to today
restricted Platinum content