
Pause at the highs, the technical picture holds
Enel slips 1.4% after brushing its highs: the bounce stalls at the Bollinger Band
Pause at the highs, the technical picture holds
Our view last week
Enel is in week 12 of a buy setup opened with weakness signals in the confirmation week, but the coverage from our most advanced model is now complete: all 3 targets have been hit and the trade is up 3.99% since entry. The stop stays dynamic, adjusting week by week to buying and selling pressure, and the price is hugging its all-time highs. Earnings are approaching, expected on July 30.
This week's summary
Enel shares slipped 1.4% this week after a run toward their all-time high: the stock was rejected at the daily Bollinger Band's upper edge, with sellers taking over the last candle and buyer dominance fading. Underneath, the picture holds — momentum is accelerating, the ADX is climbing, and money flow stays positive. This week's technical read on Enel points to a healthy pause in the uptrend.
Open long
·13th week from start
·EU-UK stocks
·T1 Featured
·📅 Earnings · Jul 30
★ See Gold version →
IQS Phase
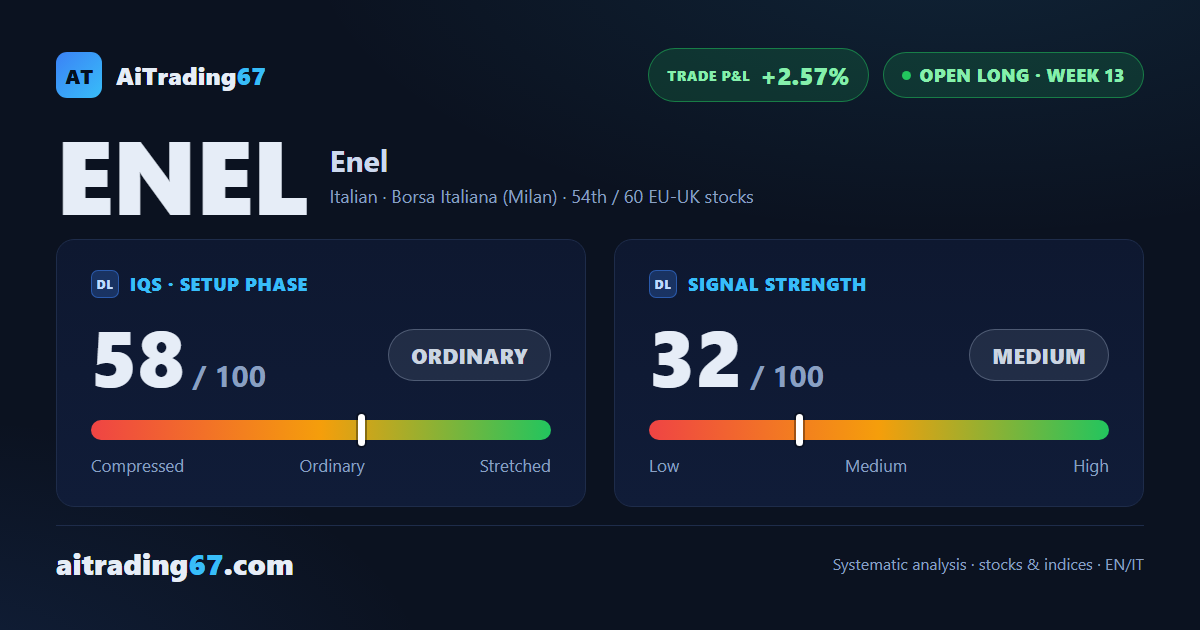
58
ordinary
Signal Strength
32
medium · weak
Sizing
REDUCED
Ranking
#54 / 60
EU-UK stocks in progress
Trade P&L %
+2.57%
from signal to today
restricted Platinum content