
European oil & gas ETF · Buy signal, week 10
EXH1 slips 1.0% as a new high in the 57 area fails to hold at the weekly close
Our view last week
EXH1, the iShares European oil & gas ETF, gains 0.7% and sits 1.4% below its all-time highs: price is back in the 57 area, a ceiling already tested 3 times, and for now the move under way continues. On the price action front, buyers are back in front in the week's volume, though the bar itself is indecisive. EXH1 technical analysis: this is one of our weekly buy signals, now in week 9, with the trade up 4.4%.
This week's summary
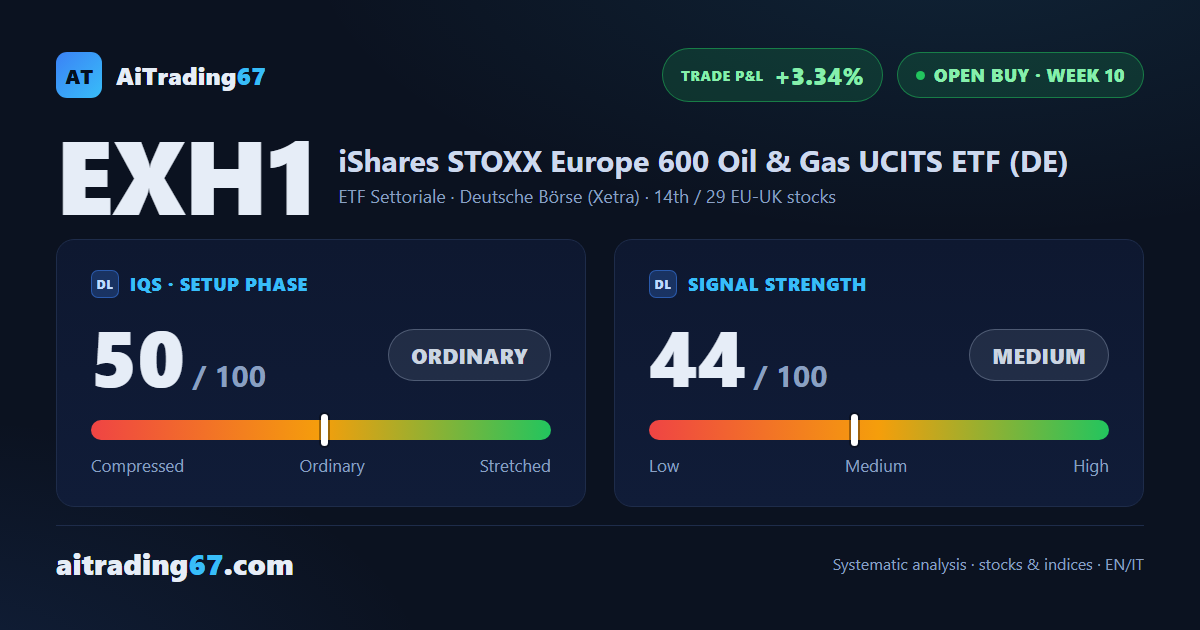
EXH1, the iShares European oil & gas ETF, printed a new 30-day high in the 57 area this week, but the close did not confirm it and the week ended down 1.0%. The ceiling it approached a week ago is still there to clear, with price 2.5% below its all-time highs. On the price action front, volumes are contracting and the MACD histogram is falling again after 4 weeks of gains. EXH1 technical analysis: one of our weekly buy signals, a swing trading setup now in week 10, up 3.3%.
IQS Phase
50
ordinary
Signal Strength
44
medium · weak
Sizing
REDUCED
Ranking
#14 / 29
EU-UK stocks in progress
Trade P&L %
+3.34%
from signal to date, no stop loss
Energy Europe (EXH1) weekly chart — EMA50 · MACD · VWAP
Weekly chart · EMA50 · MACD · VWAP · Source: TradingView
Rank position
ranks 14th among the 29 Longs already running for European-UK stocks in our ranking, with a signal strength of 44 out of 100.
Sector context
SectorETF Settoriale
Benchmark ETF—
Sector regime
Performanceweekly coming soon · monthly coming soon
EXH1 belongs to the etf settoriale sector (reference ETF ).
restricted Platinum content