
ENGIE, week 9: price climbs back toward the reversal threshold
ENGIE gains 1.5% as the sell signal keeps losing ground
ENGIE, week 9: price climbs back toward the reversal threshold
In Summary
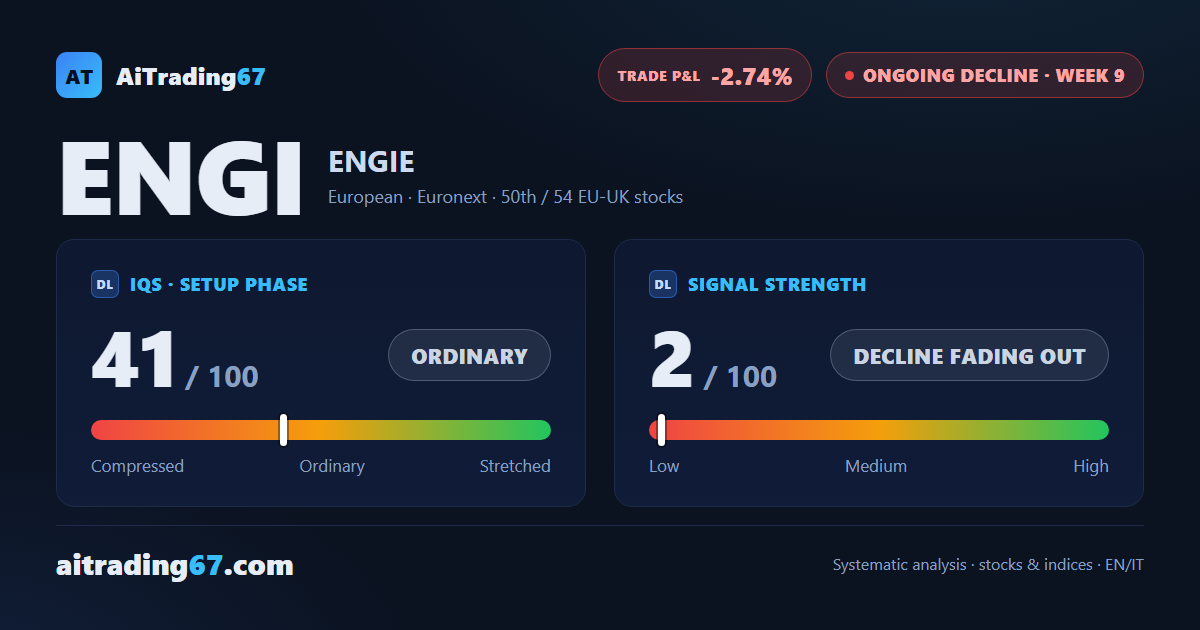
ENGIE is in week 9 of a sell signal, and the week just closed gained 1.5% with buy volume at 94%. The latest technical picture shows a decline struggling to find fresh fuel: the MACD histogram stays negative but has narrowed, the CMF turned positive after weeks in the opposite territory, and a double bottom in the 26 area on the daily chart is fueling the rebound.
IQS Phase
41
ordinary
Signal Strength
2
decline fading out
Sizing
MINIMUM
Ranking
#50 / 54
EU-UK stocks
Trade P&L %
-2.74%
from signal to today
restricted Platinum content