
ENGIE: the decline eases but keeps control
ENGIE drops 3.1% as the decline holds control without real punch
ENGIE: the decline eases but keeps control
Our view last week
ENGIE is in week 9 of a sell signal, and the week just closed gained 1.5% with buy volume at 94%. The latest technical picture shows a decline struggling to find fresh fuel: the MACD histogram stays negative but has narrowed, the CMF turned positive after weeks in the opposite territory, and a double bottom in the 26 area on the daily chart is fueling the rebound.
This week's summary
ENGIE drops 3.1% this week as sellers retake control after last week's bounce, with sell volume climbing to 84%. In ENGIE's technical analysis, though, the picture underneath stays lukewarm — CMF, momentum and the MACD histogram keep converging toward zero, and the ADX is losing steam. Price stays boxed between the 27 area and the 26.7 area, with the double bottom in the 26 area still the floor further down.
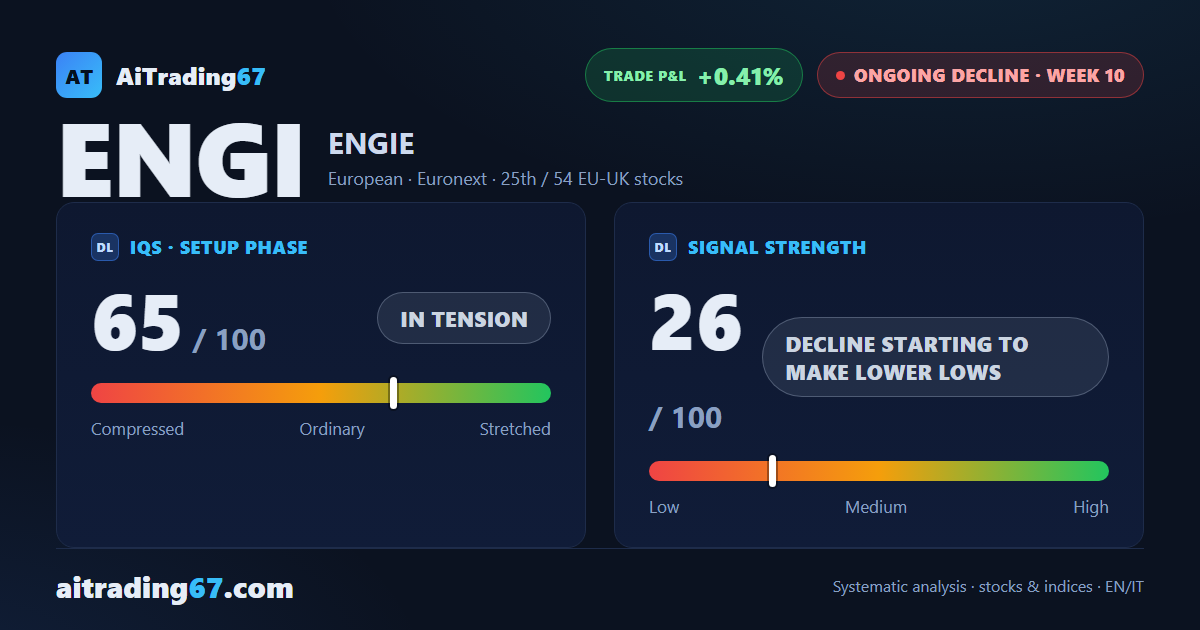
IQS Phase
65
in tension
Signal Strength
26
decline starting to make lower lows
Sizing
MINIMUM
Ranking
#25 / 54
EU-UK stocks
Trade P&L %
+0.41%
from signal to today
restricted Platinum content