
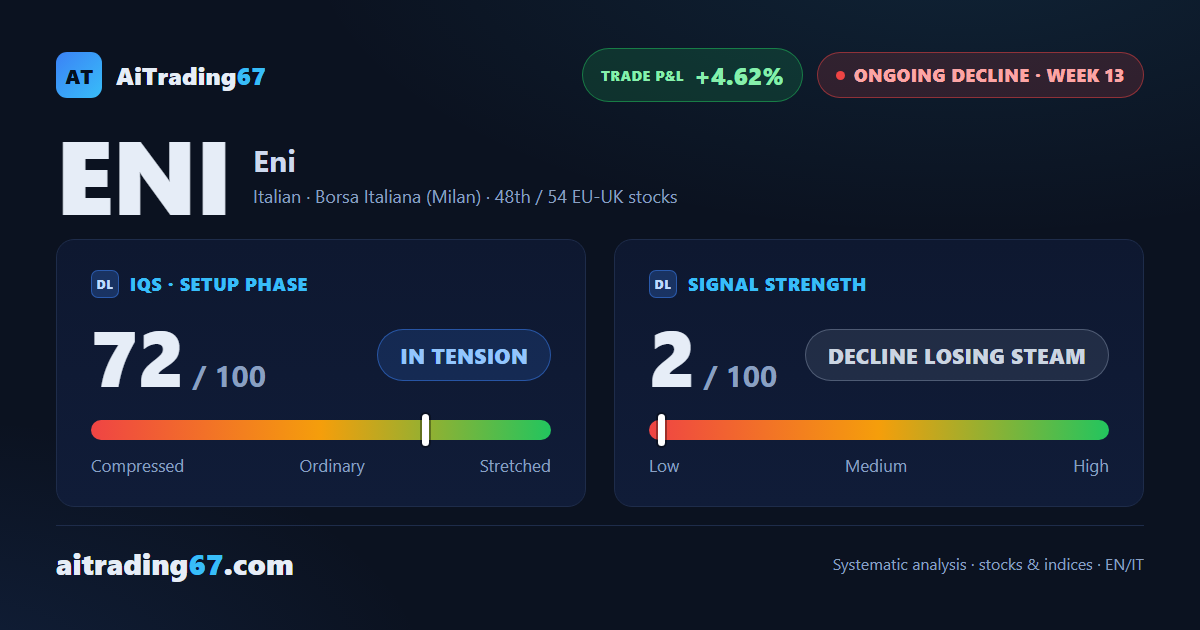
Eni: weak bounce, CMF worsening
Eni gains 1.5% this week, but money flow undercuts the bounce
Eni: weak bounce, CMF worsening
Our view last week
Week 12 of the sell signal on Eni, and the week closed up 1.1% after two straight drops of 6.6% and 6.8%. A double bottom is forming in the 20 area on the daily chart, with an intermediate 4% rebound, and selling volume is contracting. The decline is holding direction, and it's losing the momentum of the prior weeks.
This week's summary
Eni technical analysis: the 1.5% bounce comes with money flow deteriorating, and sellers regain the edge in volume. Eni stock remains boxed under resistance in the 21 area, with ADX falling for a fourth straight week — the trend is losing conviction, but the decline holds, and the short sits up 4.6%.
IQS Phase
72
in tension
Signal Strength
2
decline losing steam
Sizing
MINIMUM
Ranking
#48 / 54
EU-UK stocks
Trade P&L %
+4.62%
from signal to today
restricted Platinum content