
Eni, the decline slows down
Eni bounces 4.3% off a double bottom as the sell signal loses its edge
Eni, the decline slows down
Our view last week
Eni technical analysis: the 1.5% bounce comes with money flow deteriorating, and sellers regain the edge in volume. Eni stock remains boxed under resistance in the 21 area, with ADX falling for a fourth straight week — the trend is losing conviction, but the decline holds, and the short sits up 4.6%.
This week's summary
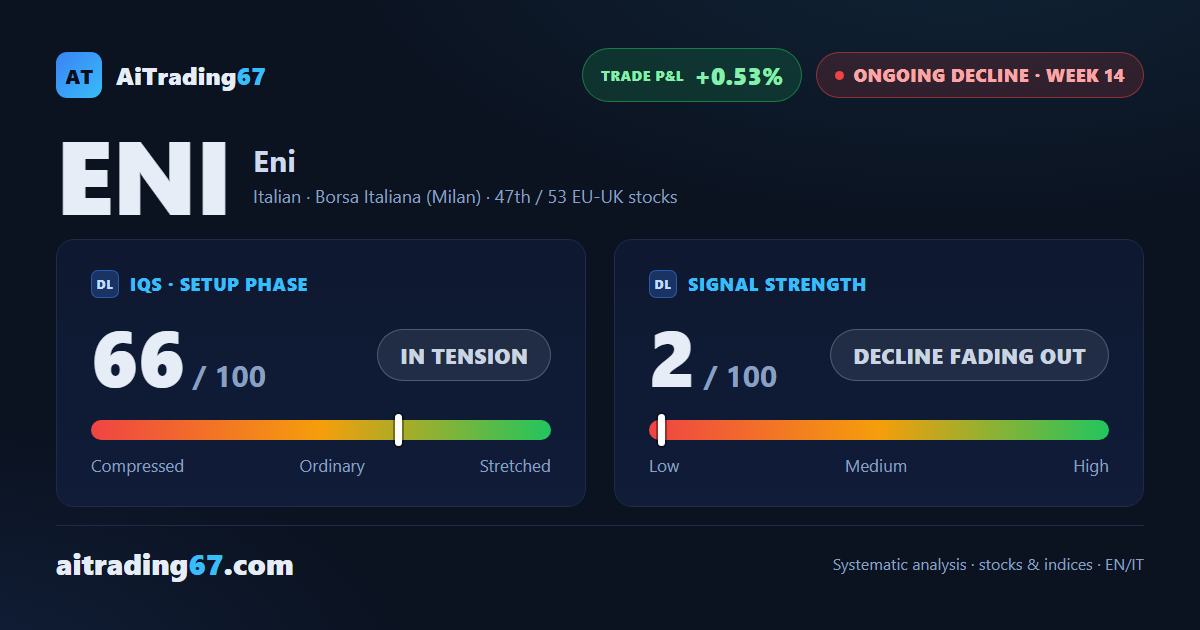
Eni's sell signal is now 14 weeks old, and the bounce has turned persistent: three straight weeks higher, the latest closing up 4.3% off a clean double bottom in the 20 area. ADX has fallen for a fourth consecutive week - the trend is losing conviction - while money flow stays negative even as buyers return on volume. The short, which a week ago was running above 4% in profit, is now nearly back to breakeven.
IQS Phase
66
in tension
Signal Strength
2
decline fading out
Sizing
MINIMUM
Ranking
#47 / 53
EU-UK stocks
Trade P&L %
+0.53%
from signal to today
restricted Platinum content