
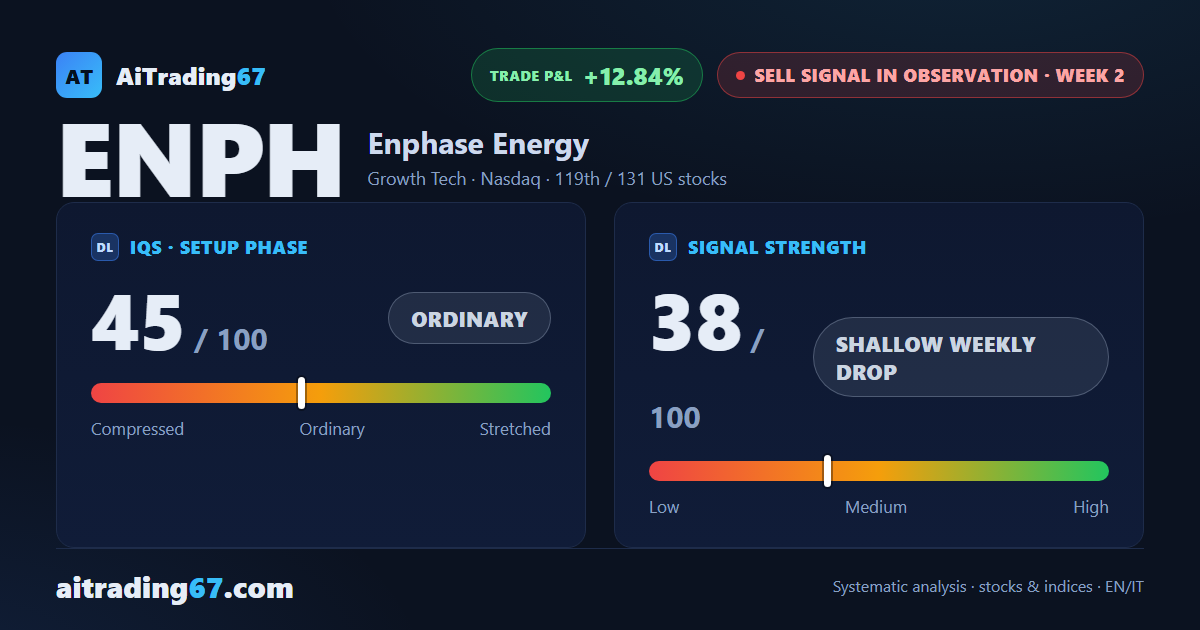
Sell signal — 2nd week under observation
Enphase Energy: struggling sell signal, double bottom taking shape
Sell signal — 2nd week under observation
In Summary
Enphase Energy is in week 2 of a sell signal, with the confirmation week closing bearish — yet the picture is more nuanced than the headline suggests. On the daily chart, a strong double bottom pattern is forming in the 45 area, a meaningful contrarian signal that challenges the short narrative. Our model flags elevated risk: 119th out of 131 US sell signals, with trading not recommended.
IQS Phase
45
ordinary
Signal Strength
38
shallow weekly drop
Sizing
REDUCED
Ranking
#119 / 131
US stocks sell signals
Trade P&L %
+12.84%
from signal to today
restricted Platinum content