
Siemens Energy, sell signal fading in week 5
Siemens Energy climbs 9.2% as the sell signal loses its edge
Siemens Energy, sell signal fading in week 5
In Summary
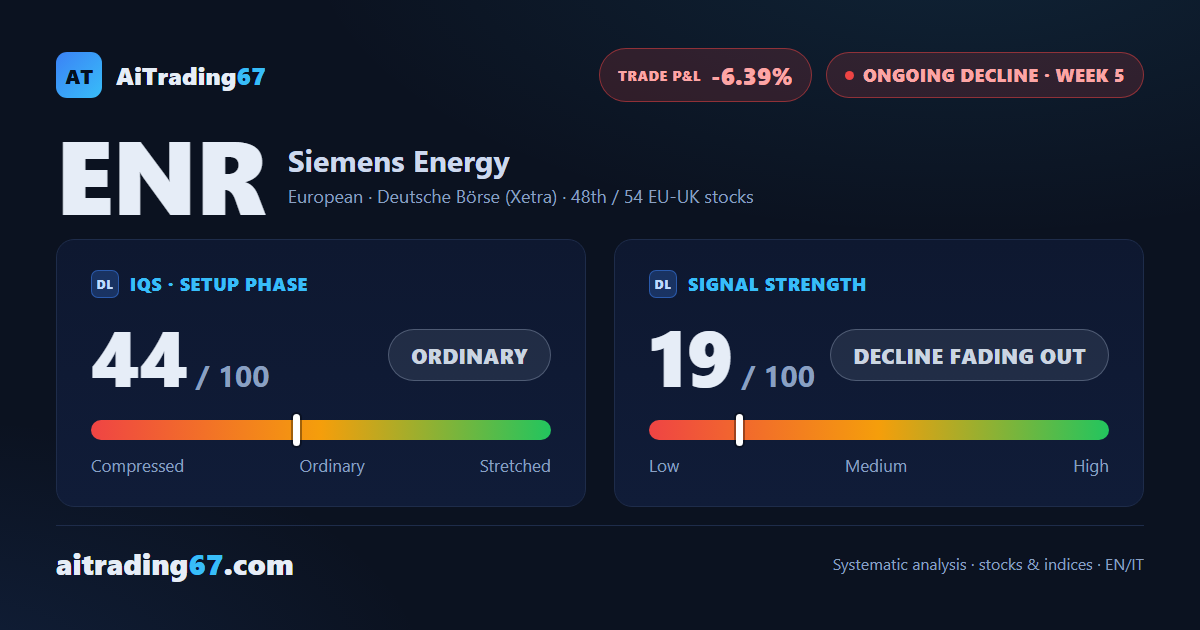
Siemens Energy is in week 5 of a sell signal, and the week just closed up 9.2%, pushing price back toward the Inversion Point. Signal strength drops to 19 out of 100, a reading that here points to a decline running low on fuel. The setup quality indicator holds at 44 out of 100, ordinary range, and the stock ranks 48th among the 54 European sell signals.
IQS Phase
44
ordinary
Signal Strength
19
decline fading out
Sizing
MINIMUM
Ranking
#48 / 54
EU-UK stocks
Trade P&L %
-6.39%
from signal to today
restricted Platinum content