
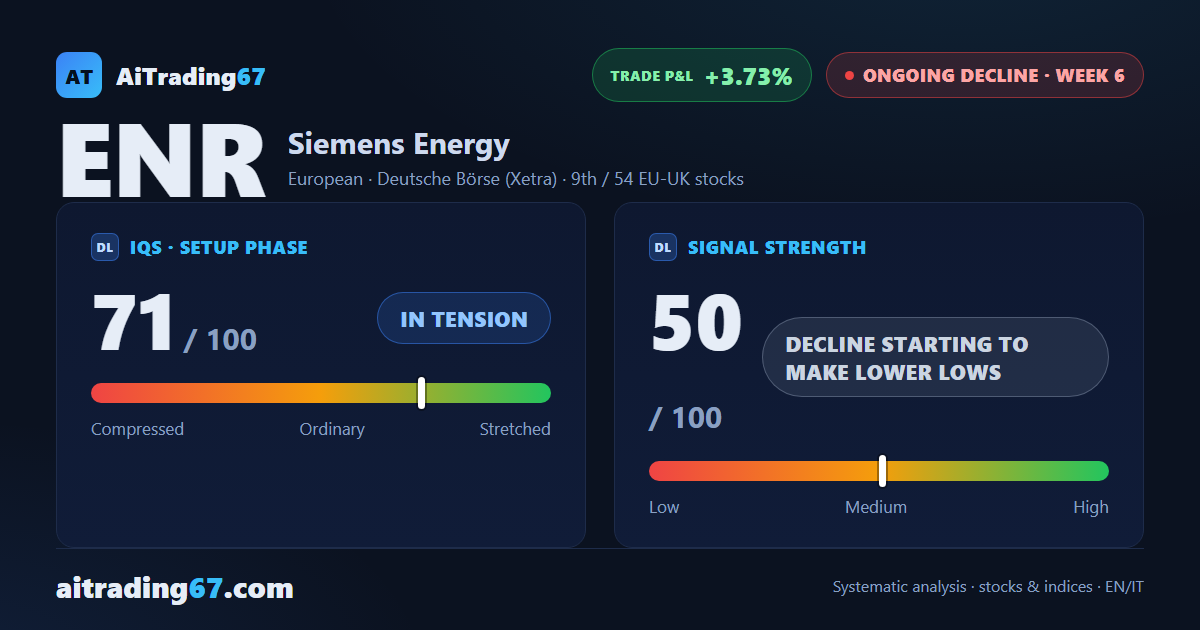
Sell signal in management, a choppy 6th week
Siemens Energy falls 9.5% and slips back under sellers' grip
Sell signal in management, a choppy 6th week
Our view last week
Siemens Energy is in week 5 of a sell signal, and the week just closed up 9.2%, pushing price back toward the Inversion Point. Signal strength drops to 19 out of 100, a reading that here points to a decline running low on fuel. The setup quality indicator holds at 44 out of 100, ordinary range, and the stock ranks 48th among the 54 European sell signals.
This week's summary
Siemens Energy shares stay choppy: last week's 9.2% bounce has been wiped out by a 9.5% drop this week. Money flow has worsened for a third straight week, hitting its most negative reading of the four, while the latest session saw sellers snap back in full control. The stock remains boxed into a tight band between the 150.6 and 152.6 areas, with the sell signal still open and the trade modestly in the money.
IQS Phase
71
in tension
Signal Strength
50
decline starting to make lower lows
Sizing
STANDARD
Ranking
#9 / 54
EU-UK stocks
Trade P&L %
+3.73%
from signal to today
restricted Platinum content