
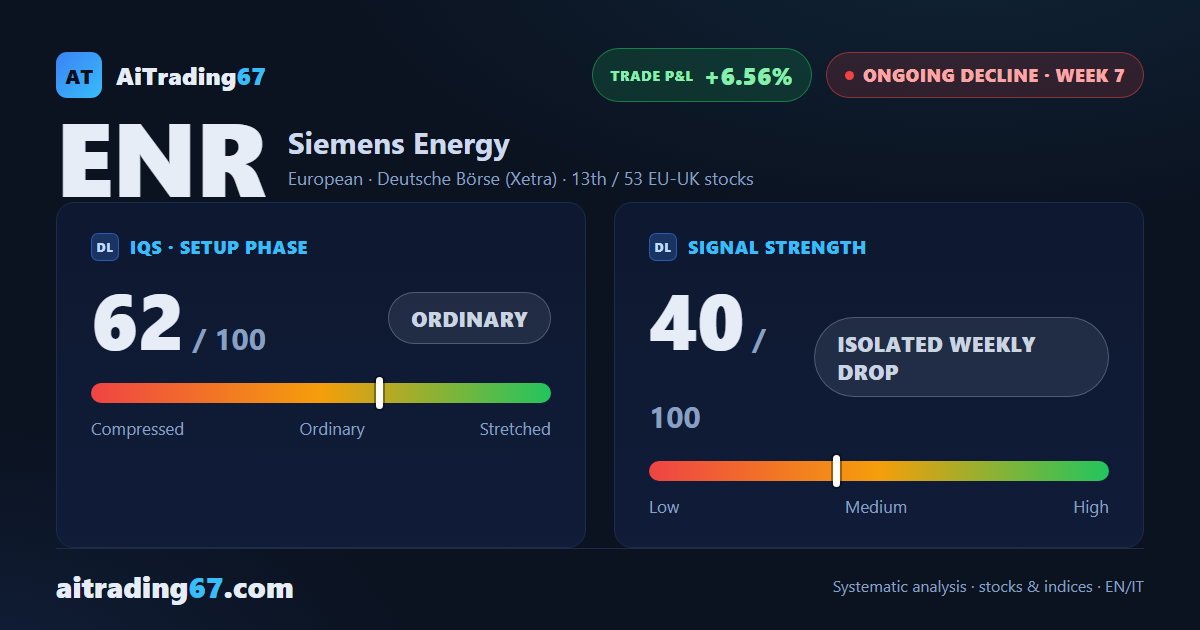
Siemens Energy: the decline eases in week 7
Siemens Energy slips 2.9% as the decline eases after last week's plunge
Siemens Energy: the decline eases in week 7
Our view last week
Siemens Energy shares stay choppy: last week's 9.2% bounce has been wiped out by a 9.5% drop this week. Money flow has worsened for a third straight week, hitting its most negative reading of the four, while the latest session saw sellers snap back in full control. The stock remains boxed into a tight band between the 150.6 and 152.6 areas, with the sell signal still open and the trade modestly in the money.
This week's summary
Siemens Energy's decline is losing steam: this week's drop eases to 2.9%, far milder than last week's 9.5% plunge. Money flow stays negative but improves slightly, while the ADX keeps fading for a fourth straight week, a sign the downtrend is losing conviction. The price remains boxed between the 146 and 154 areas, with the short now more than 6% in the money.
IQS Phase
62
ordinary
Signal Strength
40
isolated weekly drop
Sizing
REDUCED
Ranking
#13 / 53
EU-UK stocks
Trade P&L %
+6.56%
from signal to today
restricted Platinum content