
Eaton stuck in a tight range, double bottom vs resistance
Eaton slips 1.8% and stays boxed between the 399 and 403 areas
Eaton stuck in a tight range, double bottom vs resistance
Our view last week
Eaton shares bounce back, up 2.2% this week, with buyers back in charge - 60% of volume - after last week's heavy sell-off. The rebound doesn't fully convince, though: money flow keeps worsening and momentum stays negative, while price sits boxed into a tight band between resistance and support. Our weekly technical analysis keeps tracking the trade, now well into its management phase.
This week's summary
Eaton slipped 1.8% this week, giving back part of last week's bounce and boxing itself again between resistance from the 50-day average, in the 403 area, and support from the daily Kumo ceiling, in the 399 area - the same tight corridor flagged seven days ago. Money flow improves slightly but stays negative, while the MACD histogram keeps worsening: an undecided picture, with the double bottom in the 379 area now behind it.
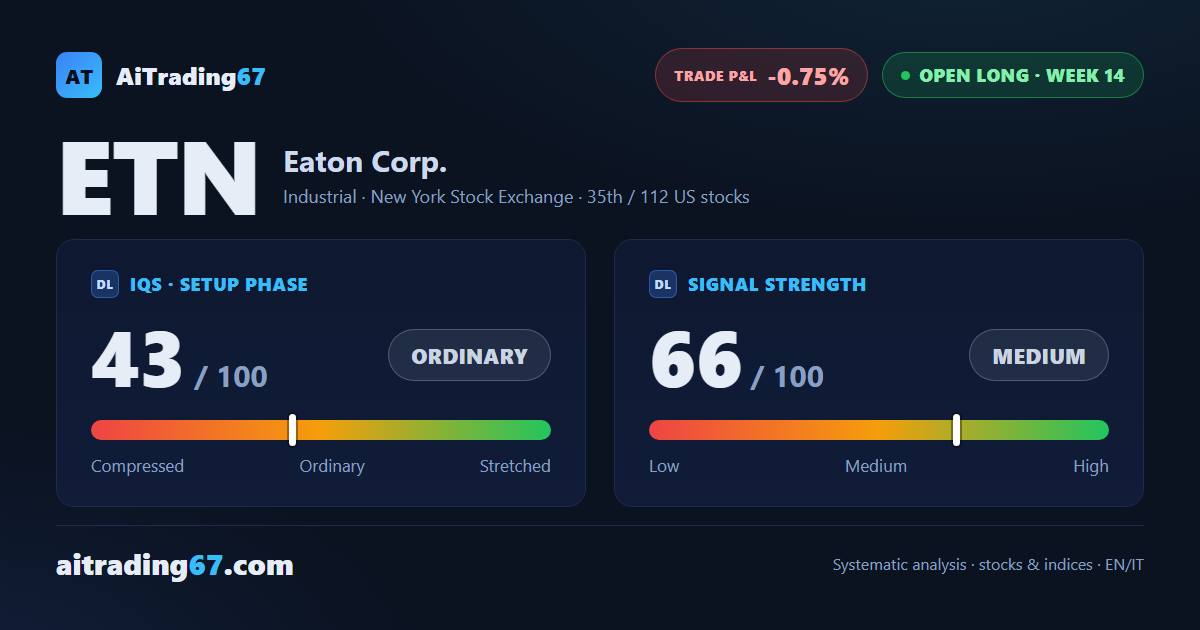
IQS Phase
43
ordinary
Signal Strength
66
medium
Sizing
STANDARD
Ranking
#35 / 112
US stocks in progress
Trade P&L %
-0.75%
from signal to today
restricted Platinum content