
Europe Oil & Gas ETF: 3.5% bounce, ADX fading
Europe's Oil & Gas ETF bounces 3.5% as the sell signal loses conviction
Europe Oil & Gas ETF: 3.5% bounce, ADX fading
Our view last week
On the European Oil & Gas sector ETF, the sell signal has reached its fourth week without ever convincing: this week the price stayed almost flat (+0.7%), squeezed into a very tight range, with volumes contracting and a distribution phase underway. Signal strength drops to just 2 out of 100 — a decline losing steam — and the fund slips to 44th among the 54 European sell signals. The setup quality indicator is climbing, a sign of building tension: the picture calls for patience.
This week's summary
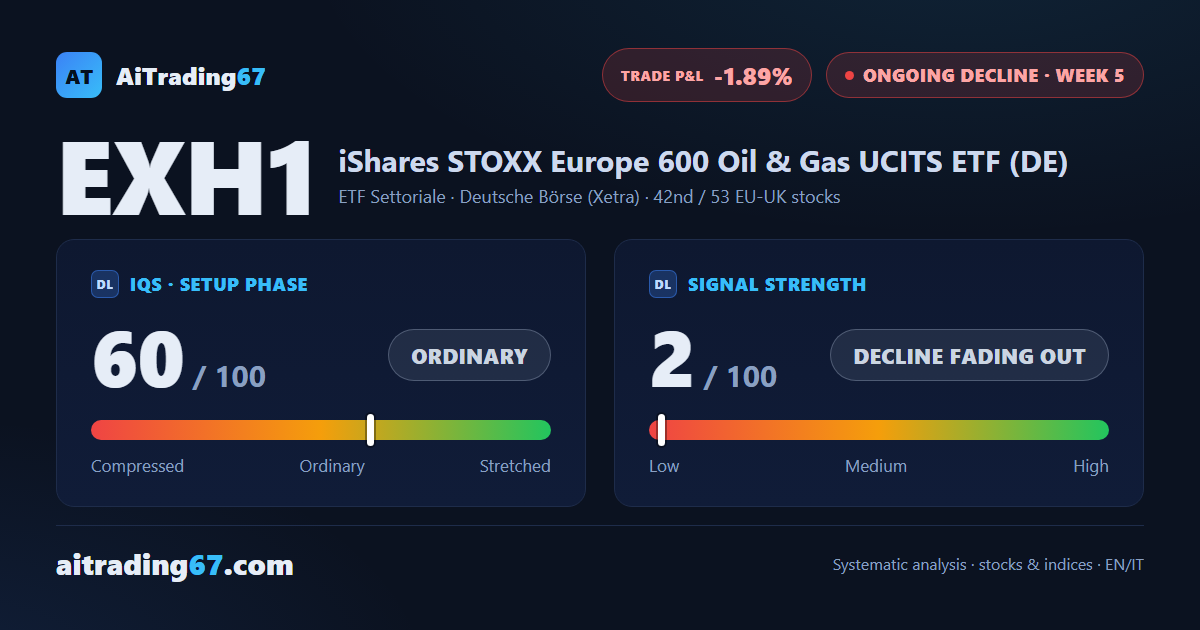
On the European Oil & Gas sector fund the picture just shifted: after touching its 20-day moving average (the 51 area), the price bounced 3.5% with 83% of the week's volume on the buy side. Compared with last week's flat, distribution-heavy tape, the weekly RSI climbs to 56 and the ADX drops to 26: the decline is losing conviction. Money flow stays negative and distribution continues: the sell signal, now in its fifth week, still hasn't confirmed.
IQS Phase
60
ordinary
Signal Strength
2
decline fading out
Sizing
MINIMUM
Ranking
#42 / 53
EU-UK stocks
Trade P&L %
-1.89%
from signal to today
restricted Platinum content