
Ford bounces 4.8%, the Sell signal fails to confirm
Ford bounces 4.8% off a double bottom, and the Sell signal fails to confirm
Ford bounces 4.8%, the Sell signal fails to confirm
Our view last week
Ford Motor Company is in week 3 of a sell signal: the week just closed down 5.4%, and the decline keeps making lower lows. Signal strength, at 35 out of 100, describes exactly that: a decline that's still healthy, not an exhausted move. The stock ranks 91st among the 137 US sell signals, and opening a new position remains high-risk per our model.
This week's summary
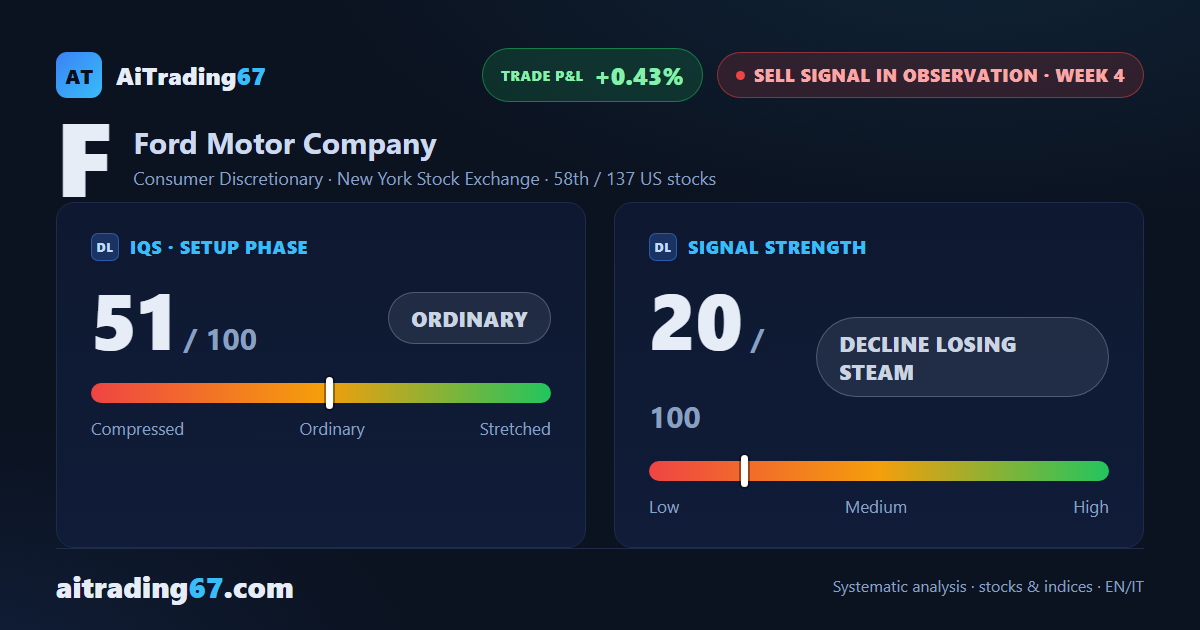
Ford shares bounce 4.8% off a double bottom in the 13 area, and the weekly price stays above the Ichimoku cloud: in our weekly technical analysis, these are the signs the Sell signal failed the three-week confirmation test. Signal strength drops to 20 out of 100 — a decline losing steam. Ford slips to 58th among the 137 US sell signals, and opening a new position remains high-risk per our model.
Sell signal in observation
·4th week from start
·US stocks
·T2
·📅 Earnings · Jul 29
★ See Gold version →
IQS Phase
51
ordinary
Signal Strength
20
decline losing steam
Sizing
MINIMUM
Ranking
#58 / 137
US stocks sell signals
Trade P&L %
+0.43%
from signal to today
restricted Platinum content