
FuelCell Energy: -25% this week, trade still up 88%
FuelCell Energy sheds 25.2% and bounces off its own 50-day moving average
FuelCell Energy: -25% this week, trade still up 88%
Our view last week
FuelCell Energy is up 151% since the trade opened, in week 10 of a buy signal. Signal strength stays high at 87 out of 100, a high-conviction profile that is also wide and volatile — a significant move to manage with discipline. The model has just reached its third statistical management window, with a suggested 30% trim and the stop still sitting at breakeven on entry.
This week's summary
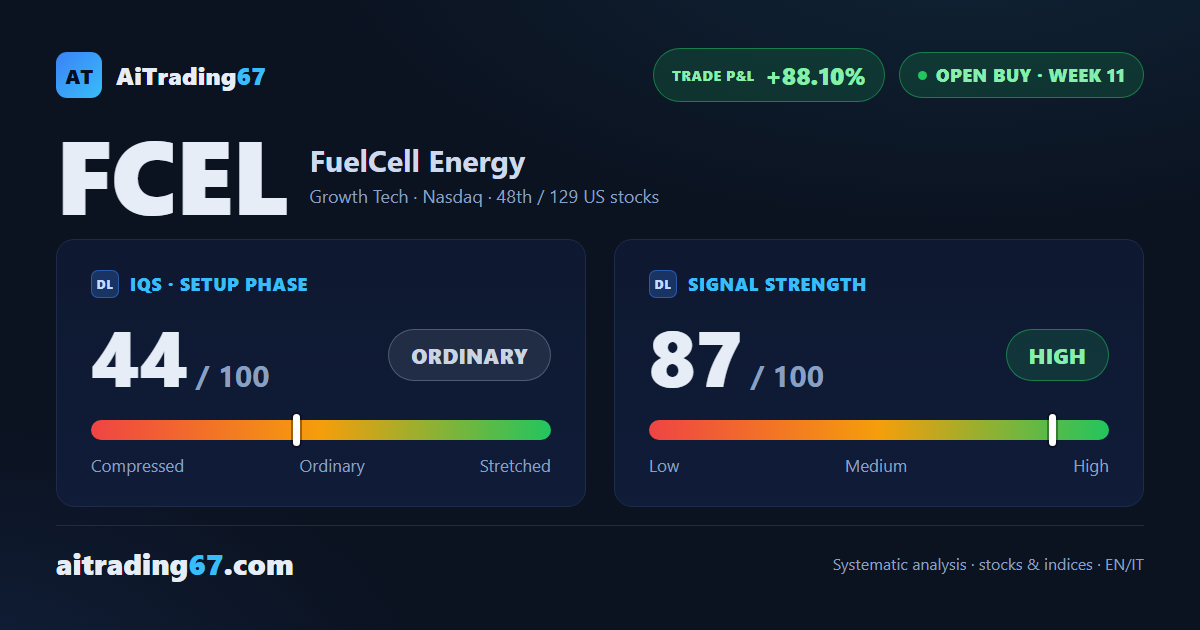
FuelCell Energy sheds 25.2% in a rough week, closing with a 2% bounce off its own 50-day moving average. The weekly picture stays bullish, though three warning flags have popped up: collapsing buyer dominance and sellers ruling the last bar. In this technical analysis of FuelCell Energy stock, signal strength stays high at 87 out of 100, and the trade is still up 88% since entry.
IQS Phase
44
ordinary
Signal Strength
87
high · wide & volatile
Sizing
FULL
Ranking
#48 / 129
US stocks in progress
Trade P&L %
+88.10%
from signal to today
restricted Platinum content