
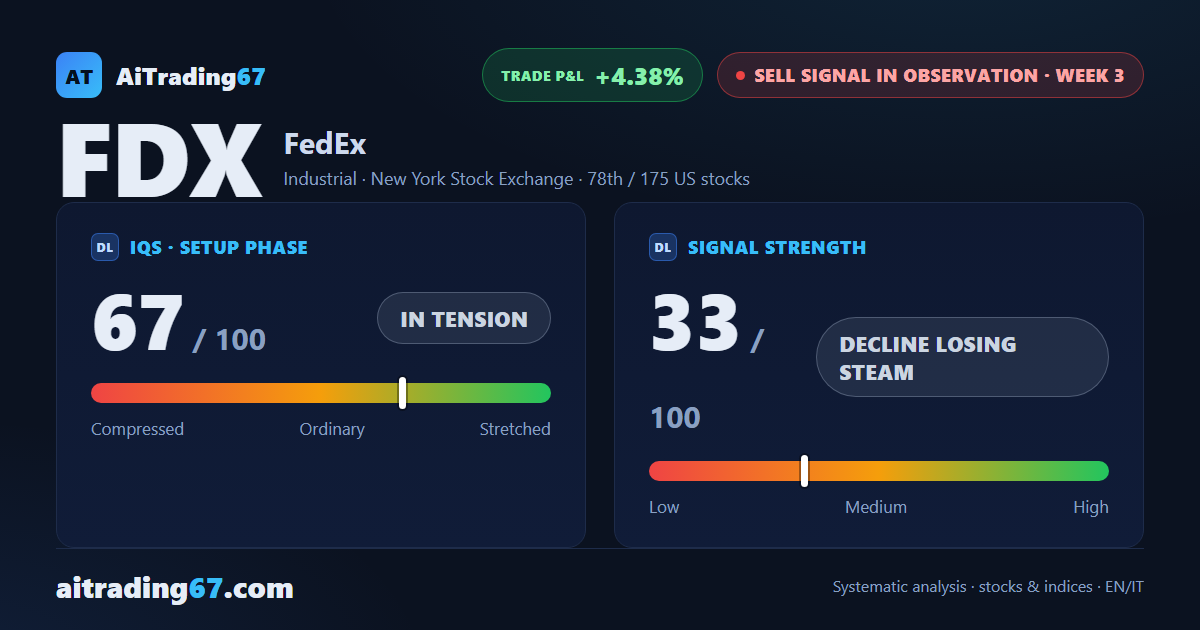
Sell signal · week 3 · US stocks
FedEx gains 1.6% and climbs back above its 50-week average as the decline loses steam
Our view last week
FedEx stock gives up 5.9% and slips just under its 50-week moving average, while the daily chart lines up 5 lower highs, from the 330 area down to the 309 area. The Sell signal that fired a week ago has found its stride: the price action shows sellers ahead in the weekly bar and distribution underway, with signal strength maxed out at 100 out of 100. Price, though, is working close to its 30-week low, so the quality band flags trading as not recommended.
This week's summary
The daily run of lower highs has been broken: on Oct 2 a close rose above the last high, and FedEx stock ends the week up 1.6%, back above the 50-week moving average it lost a week ago. The Sell signal, whose strength was maxed out back then, now describes a decline losing steam. Still, the price action alone does not turn the picture: among US stocks under a sell signal, FedEx keeps the MACD histogram and money flow in negative territory, and the quality band flags trading as not recommended.
IQS Phase
67
in tension
Signal Strength
33
decline losing steam
Sizing
REDUCED
Ranking
#78 / 175
US stocks sell signals
Trade P&L %
+4.38%
from signal to date, no stop loss
FedEx (FDX) weekly chart — EMA50 · MACD · VWAP
Weekly chart · EMA50 · MACD · VWAP · Source: TradingView
Rank position
ranks 78th among the 175 sell signals for US stocks in our ranking, with a signal strength of 33 out of 100.
Sector context
SectorIndustrial
Benchmark ETFXLI
Sector regimeweak phase
Performanceweekly -0.28% · monthly -1.64%
FDX belongs to the industrial sector (reference ETF XLI). The sector is classified weak phase according to our weekly reading.
restricted Platinum content