
Figma, sell signal in week 3
Figma jumps 14.6% and puts the sell signal to the test
Figma, sell signal in week 3
In Summary
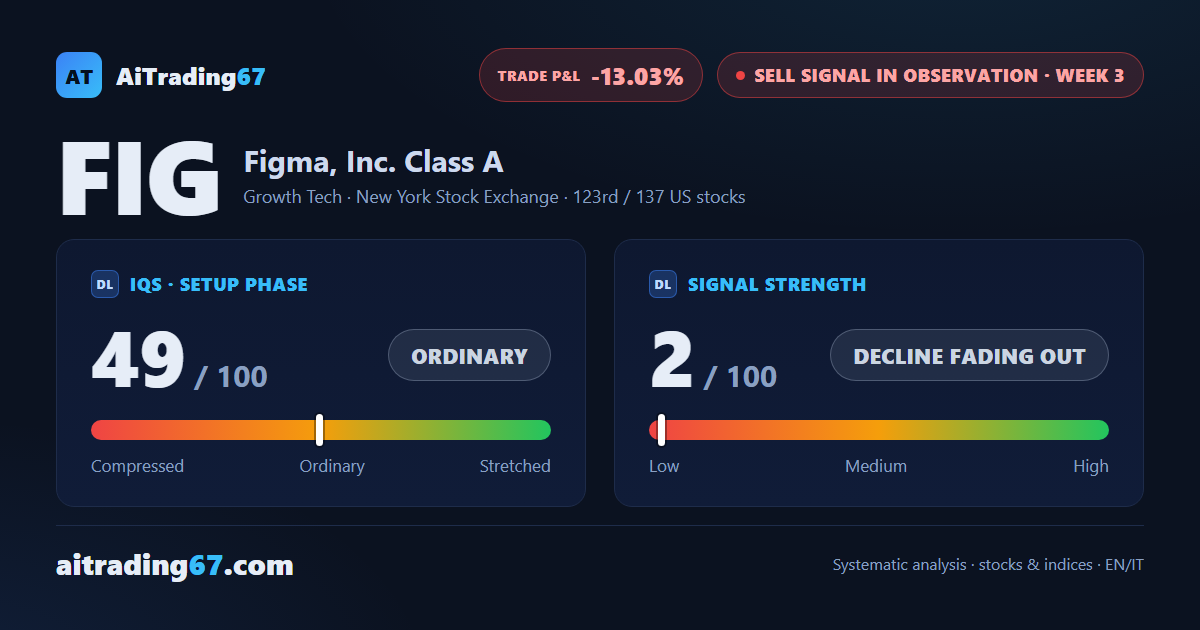
Figma is in week 3 of a sell signal, and the week that just closed posted a 14.6% jump. A double bottom in the 18 area is fueling the rebound, and signal strength has dropped to 2 out of 100: the picture points to a decline running out of room. The setup quality indicator sits at 49 out of 100, in the ordinary band, and Figma ranks 123rd among the 137 US sell signals.
IQS Phase
49
ordinary
Signal Strength
2
decline fading out
Sizing
MINIMUM
Ranking
#123 / 137
US stocks sell signals
Trade P&L %
-13.03%
from signal to today
restricted Platinum content