
Figma: new buy signal in its 1st week
Figma jumps 13.5% and clears its highs: a new buy signal fires
Figma: new buy signal in its 1st week
Our view last week
After last week's 14.6% surge, Figma's rebound has stalled: the stock gave back 1.1% this week, with the double bottom in the 18 area holding even as sellers turned slightly dominant on the last bar. Signal strength drops to 3 out of 100: a decline running on fumes, with price climbing back toward the Inversion Point. In this week's technical analysis, Figma stock remains one to handle with care.
This week's summary
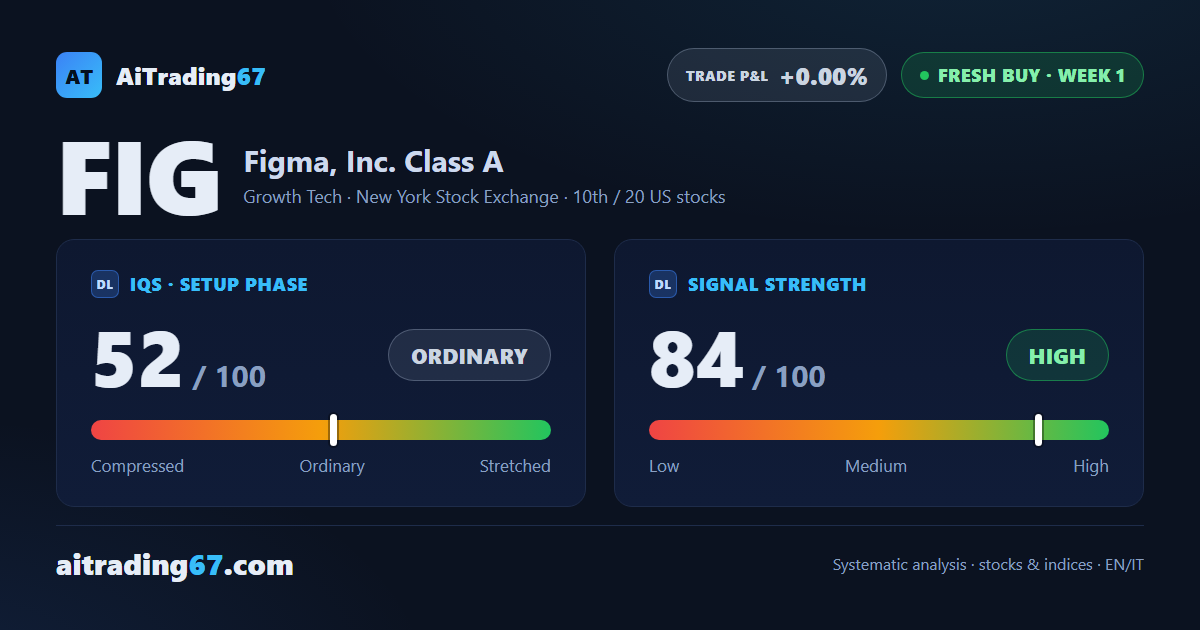
Figma stock breaks above its recent highs with a 13.5% surge, confirming the double bottom in the 18 area: a new buy signal fires. After weeks of a decline running on fumes, the picture has flipped — signal strength is high, and the move stays wide and volatile. The quality band flags an elevated-risk opening: a case worth watching closely.
IQS Phase
52
ordinary
Signal Strength
84
high · wide & volatile
Sizing
FULL
Ranking
#10 / 20
New us stocks
Trade P&L %
+0.00%
from signal to today
restricted Platinum content