
Buy signal under pressure after the bounce
Figma slides 11.8% in confirmation week as sellers dominate the last session
Buy signal under pressure after the bounce
Our view last week
Figma stock breaks above its recent highs with a 13.5% surge, confirming the double bottom in the 18 area: a new buy signal fires. After weeks of a decline running on fumes, the picture has flipped — signal strength is high, and the move stays wide and volatile. The quality band flags an elevated-risk opening: a case worth watching closely.
This week's summary
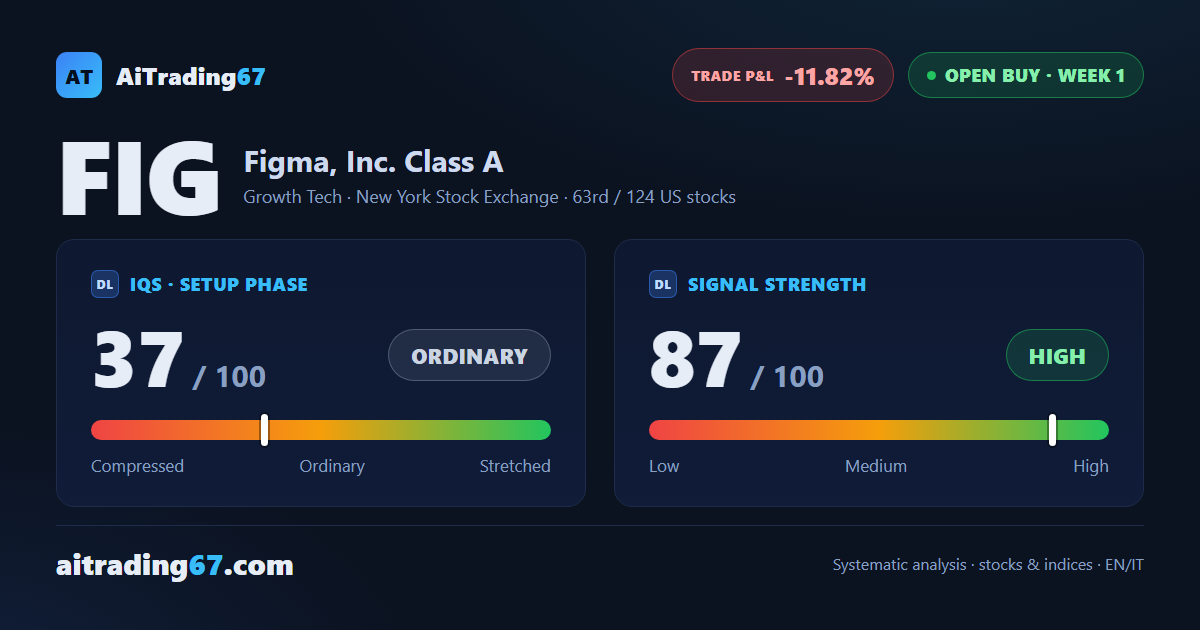
Figma stock's bounce loses steam: the week closes down 11.8%, with sellers clearly dominant in the last session and distribution underway. The double bottom in the 18 area still holds, but the volume picture has flipped from last week's surge. Our model flags a negative confirmation week for the buy signal.
IQS Phase
37
ordinary
Signal Strength
87
high · wide & volatile
Sizing
FULL
Ranking
#63 / 124
US stocks in progress
Trade P&L %
-11.82%
from signal to today
Rank position
ranks 63rd among the 124 Longs already running for US stocks in our ranking, with a signal strength of 87 out of 100.
Sector context
SectorGrowth Tech
Benchmark ETFXLK
Sector regimeweak phase
Performanceweekly +0.17% · monthly -3.92%
FIG belongs to the growth tech sector (reference ETF XLK). The sector is classified weak phase according to our weekly reading.
restricted Platinum content