
Sell signal, week 6: the rebound stalls
Figure Technology slips 6.2% as the rebound stalls and the short stays underwater
Sell signal, week 6: the rebound stalls
Our view last week
FIGR is in the fifth week of a sell signal, and the week that just closed logged a 26.2% jump that brings the price a step from the Inversion Point. Signal strength drops to 2 out of 100 as a result: the decline has run out of room. The setup quality indicator holds at 50 out of 100, in the ordinary band, and FIGR ranks 119th among the 137 US sell signals.
This week's summary
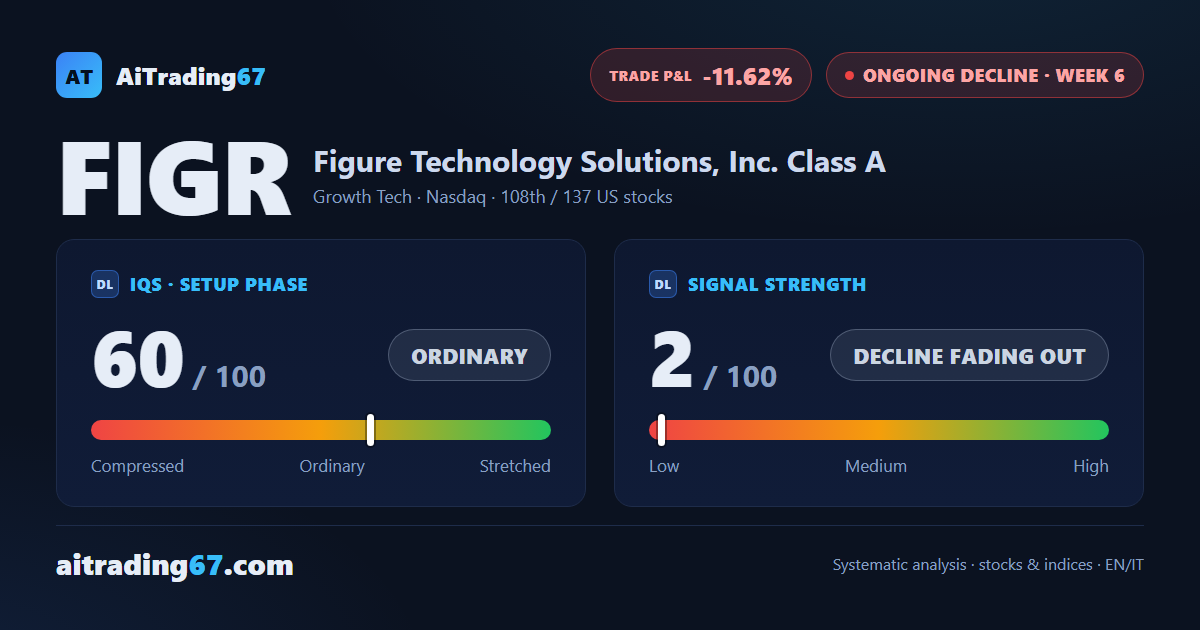
Figure Technology's rally has stalled: after last week's 26.2% surge, the stock gave back 6.2%, with almost 70% of the volume on the sell side. Price is now boxed between the resistance of its 50-day average and the support of its 20-day average. The short, open for six weeks, still sits at an 11.6% loss, but downside momentum is losing steam.
IQS Phase
60
ordinary
Signal Strength
2
decline fading out
Sizing
MINIMUM
Ranking
#108 / 137
US stocks
Trade P&L %
-11.62%
from signal to today
restricted Platinum content