
New Sell signal · US stocks
Figure Technology drops 10.6% while tech rallies: a Sell signal kicks in
Our view last week
Last week's rebound didn't last: Figure Technology stock gave up 10.1% and slid back toward the lows of seven days ago, while US tech stocks as a group gained 3.5%. The price action is blunt: in the weekly bar sellers dominated to an extreme, with buying below 25% of volume. The technical analysis shows a buy signal still live, with price close to the Inversion Point and the trade 18.4% underwater.
This week's summary
A second straight weekly drop for Figure Technology, down 10.6% to a new 30-day low while US tech stocks gained 1.8%. Figure Technology stock changes sign as a result: last week's buy signal, already struggling, gives way to a new Sell signal. Price action shows lower highs and the technical analysis has money flow negative for 4 weeks. For swing trading, though, the trade setup is rated trading not recommended.
IQS Phase
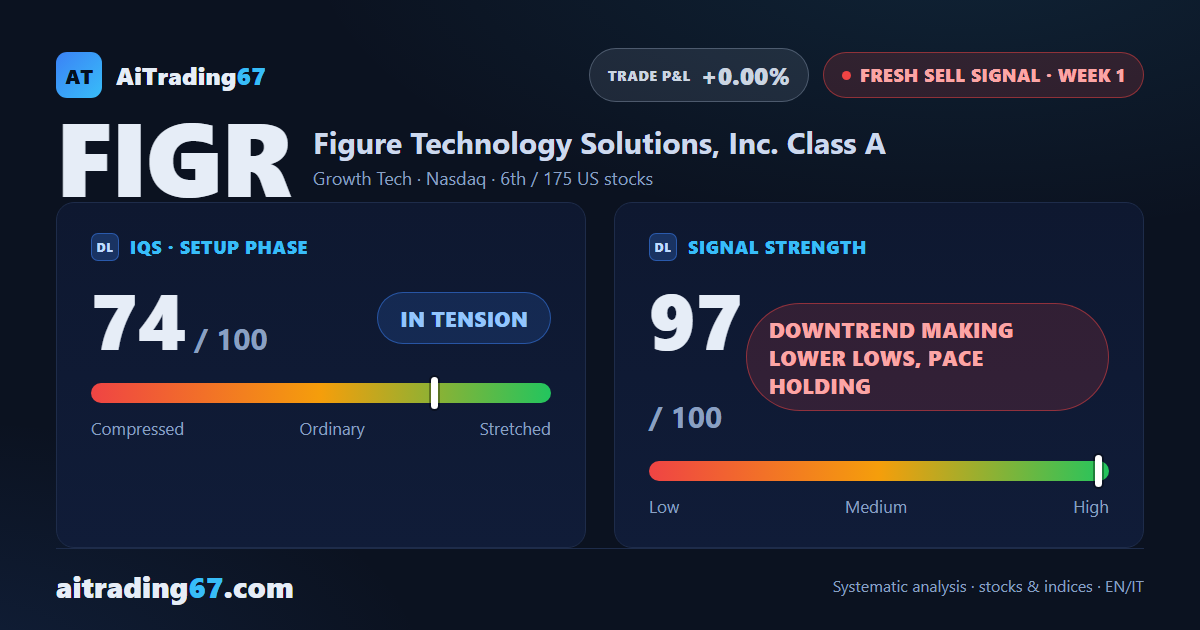
74
in tension
Signal Strength
97
downtrend making lower lows, pace holding
Sizing
STANDARD
Ranking
#6 / 175
New us stocks
Trade P&L %
+0.00%
from signal to date, no stop loss
Figure (FIGR) weekly chart — EMA50 · MACD · VWAP
Weekly chart · EMA50 · MACD · VWAP · Source: TradingView
Rank position
ranks 6th among the 175 sell signals for US stocks in our ranking, with a signal strength of 97 out of 100.
Sector context
SectorGrowth Tech
Benchmark ETFXLK
Sector regimein strong phase
Performanceweekly +1.80% · monthly +8.83%
FIGR belongs to the growth tech sector (reference ETF XLK). The sector is classified in strong phase according to our weekly reading.
restricted Platinum content