
Sell signal · week 3 · US stocks
Fiserv drops 4.6% to a fresh 90-week low as the decline gets back in gear
Our view last week
After the 8.5% plunge that fired the sell signal, Fiserv slipped just 1.5% on an indecisive weekly bar with a small body, and the week's volume swung back to the buyers. Fiserv stock still sits less than 3% above its 90-day lows and below the Ichimoku cloud. Technical analysis and price action trading reads point to a selling push that has stalled, and opening fresh shorts here is not recommended.
This week's summary
Fiserv drops 4.6% and sets a fresh 90-week low, confirmed by the weekly close: after last week's stall the decline is back in gear, with a 5th straight weekly loss. Fiserv stock stays below the Ichimoku cloud, money flow has turned negative and the weekly RSI sits in the 30 area. Technical analysis and price action trading reads show a decline still in control, with little room underneath: among US stocks, opening fresh shorts here is not recommended.
Sell signal in observation
·3rd week from start
·US stocks
·T2
·📅 Earnings · Oct 27
★ See Gold version →
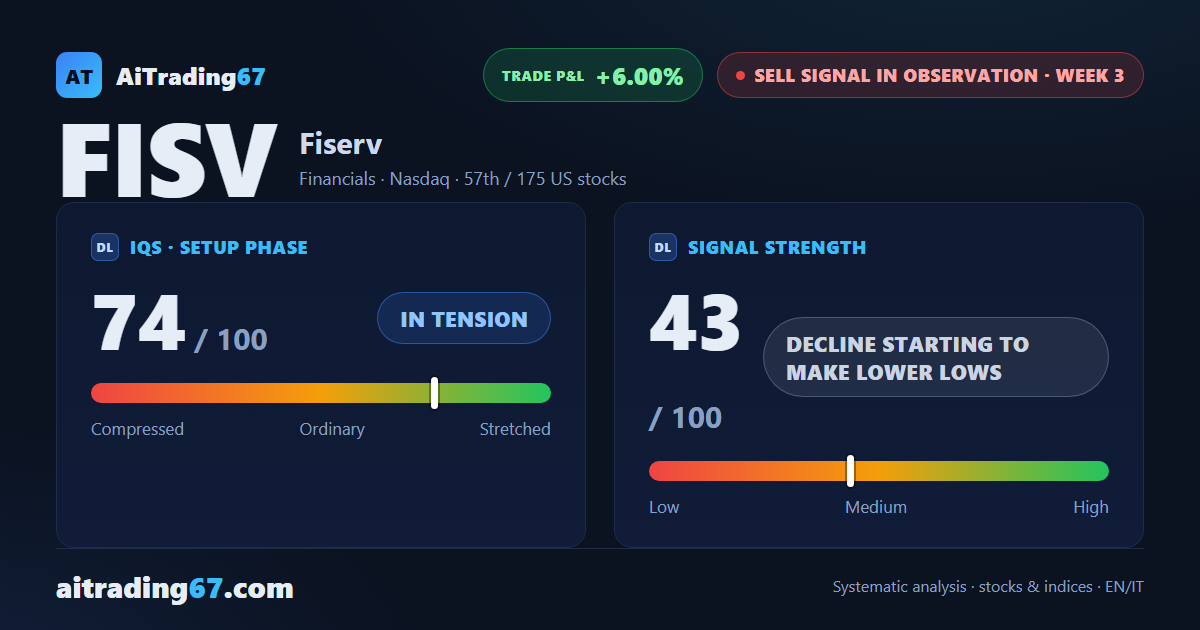
IQS Phase
74
in tension
Signal Strength
43
decline starting to make lower lows
Sizing
REDUCED
Ranking
#57 / 175
US stocks sell signals
Trade P&L %
+6.00%
from signal to date, no stop loss
Fiserv (FISV) weekly chart — EMA50 · MACD · VWAP
Weekly chart · EMA50 · MACD · VWAP · Source: TradingView
Rank position
ranks 57th among the 175 sell signals for US stocks in our ranking, with a signal strength of 43 out of 100.
Sector context
SectorFinancials
Benchmark ETFXLF
Sector regimeweak phase
Performanceweekly -2.46% · monthly -7.23%
FISV belongs to the financials sector (reference ETF XLF). The sector is classified weak phase according to our weekly reading.
restricted Platinum content