EN IT

Fiserv — decline awaiting confirmation, mixed technical signals

Fiserv is at week 4 of an unconfirmed sell signal. The trade is up 2.8% from the entry, but a double bottom in the 52 area and elevated buying volume this week complicate the bearish picture.

Fiserv — decline awaiting confirmation, mixed technical signals
Fiserv at week 4 of sell signal
Fiserv — decline awaiting confirmation, mixed technical signals
June 12, 2026
Fiserv at week 4 of sell signal
In Summary
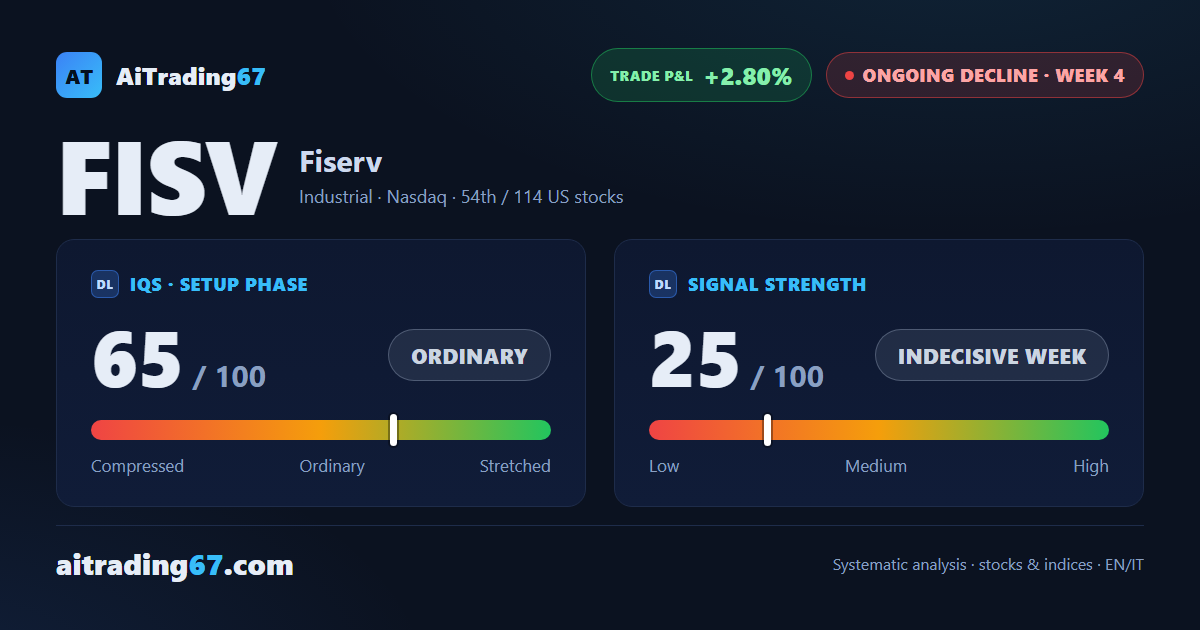
Fiserv is at week 4 of a sell signal that has not yet been confirmed: 3 weeks closed sideways, with the trade up 2.8% from the entry. On the daily chart, a double bottom has formed in the 52 area — a strong pattern per the model — and this week buying volume came back dominant. A bearish picture showing significant cracks.
Ongoing decline ·4th week from start ·US stocks ·T2 ★ See Gold version →
IQS Phase
65
ordinary
Signal Strength
25
indecisive week
Sizing
MINIMUM
Ranking
#54 / 114
US stocks
Trade P&L %
+2.80%
from signal to today
Chart · Weekly — EMA50 · MACD · VWAP
Weekly chart · EMA50 · MACD · VWAP · Source: TradingView
How to read this pageA visual guide to the post, card by card
The full analysis, operating plan and detailed levels on this asset are reserved for clients ★ PLATINUM
restricted Platinum content
Share WhatsApp Telegram Gmail LinkedIn