Sell signal · week 5
Fiserv accelerates lower: -11% last week, sellers at 90%
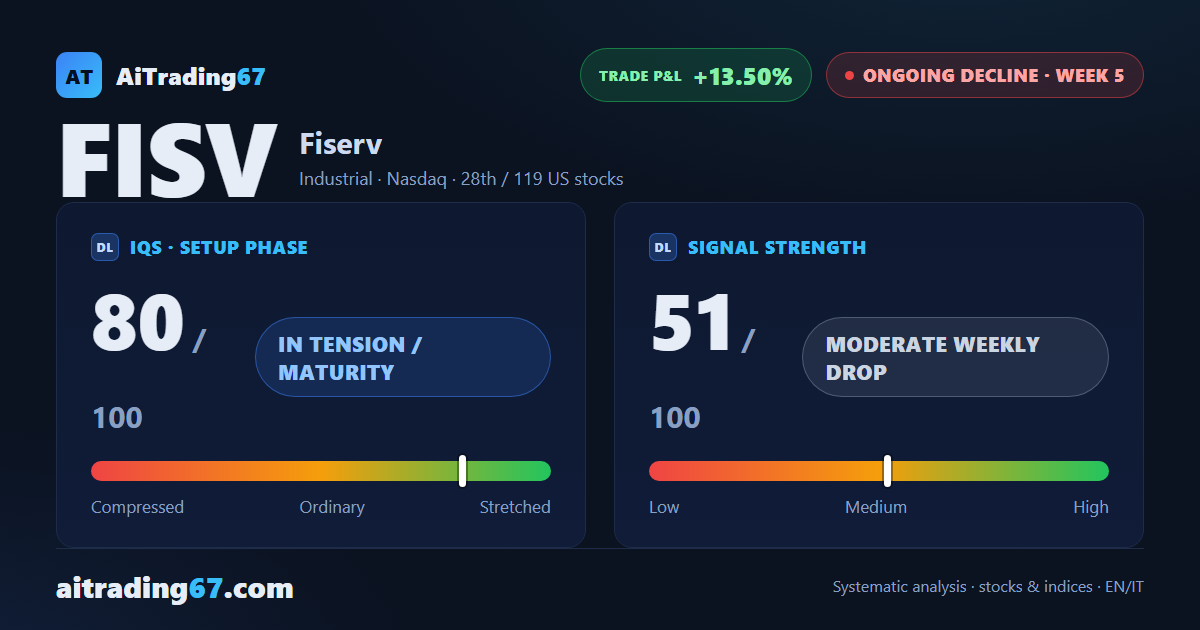
Sell signal · week 5
In Summary
Fiserv is at week 5 of a sell signal, and the decline has regained momentum sharply. After three sideways weeks with mixed signals, the latest bar fell 11% with sellers at 90% of volume. The trade is up 13.5% from entry, but trading conditions remain not recommended — the picture calls for managing an existing short position, not opening a new one.
IQS Phase
80
in tension / maturity
Signal Strength
51
moderate weekly drop
Sizing
STANDARD
Ranking
#28 / 119
US stocks
Trade P&L %
+13.50%
from signal to today
restricted Platinum content