
Fiserv: sellers retake control
Fiserv slides 3.6% as sellers retake the wheel on its sell signal
Fiserv: sellers retake control
Our view last week
Week 8 of a sell signal on Fiserv, and the week just closed gained 5.8%. The double bottom in the 47 area keeps holding, capital flow has turned back to buying, and the price now sits squeezed between the recent-high resistance above and the immediate support below: a compressed stretch of trading worth watching closely.
This week's summary
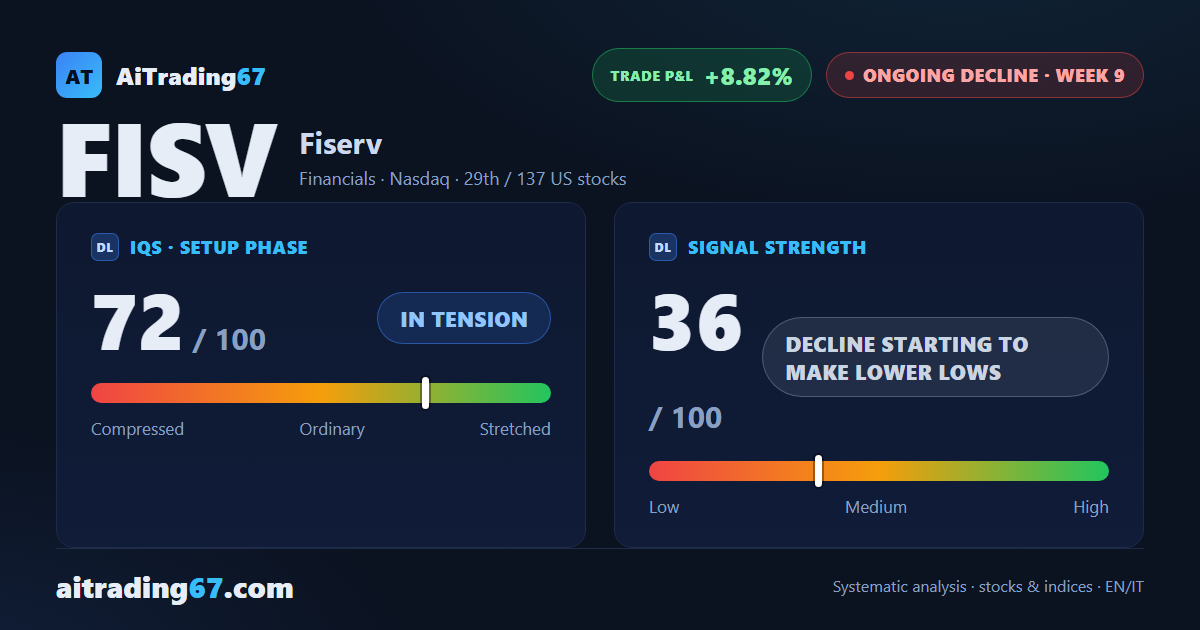
Money flow on Fiserv has turned negative again after a brief buying spell, and the week closed down 3.6%: in this week's technical analysis, the sell signal, now in its ninth week, is tightening its grip again after the previous two weeks' bounce. The double bottom in the 47 area is still holding, but sellers are back in control of the tape and the trend, still very strong, is losing conviction. The short is up 8.82%.
IQS Phase
72
in tension
Signal Strength
36
decline starting to make lower lows
Sizing
REDUCED
Ranking
#29 / 137
US stocks
Trade P&L %
+8.82%
from signal to today
restricted Platinum content