
Extreme selling hits FMC, but support near 11 holds firm
FMC drops 3.9% on extreme selling, but the double bottom in the 11 area holds
Extreme selling hits FMC, but support near 11 holds firm
Our view last week
FMC is in the 11th week of a sell signal, and the managed share is running at +23.72% since entry. The week just closed lost 3.4%, with sellers still slightly prevalent but no fresh lows of note: on the daily chart a double bottom in the 11 area still holds, with an 18% intermediate rebound. The earnings date is approaching, on July 29.
This week's summary
On FMC this week sellers took control in extreme fashion — 81% of volume on the sell side — and the stock dropped 3.9%, its sharpest weekly loss in a month. Yet the double bottom in the 11 area, which already held last week, is still standing, with no fresh low, while money flow stays mildly positive and drifting higher. A mixed picture in FMC's weekly technical analysis, worth following week by week.
IQS Phase
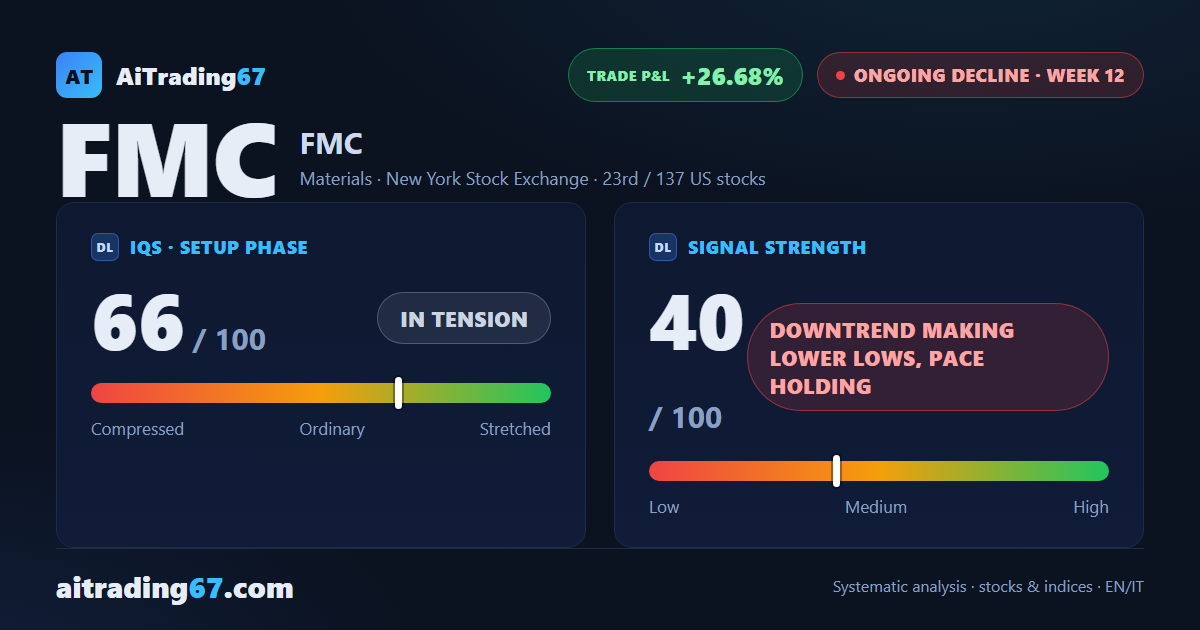
66
in tension
Signal Strength
40
downtrend making lower lows, pace holding
Sizing
REDUCED
Ranking
#23 / 137
US stocks
Trade P&L %
+26.68%
from signal to today
restricted Platinum content