
Sell signal · week 3 · fresh 90-week low
FMC Corporation drops 11.9% to a fresh 90-week low as the daily RSI sinks to 27
Our view last week
FMC stock's daily price action has lined up 4 lower highs since September 2, and the week closed with another 5.1% loss, its third red week in a row. In the weekly bar sellers still dominate to an extreme, but the Sell signal that fired a week ago has lost momentum: signal strength, at 91 last week, now describes a decline with no fresh push. The technical analysis stays bearish, and opening a new short here is high-risk.
This week's summary
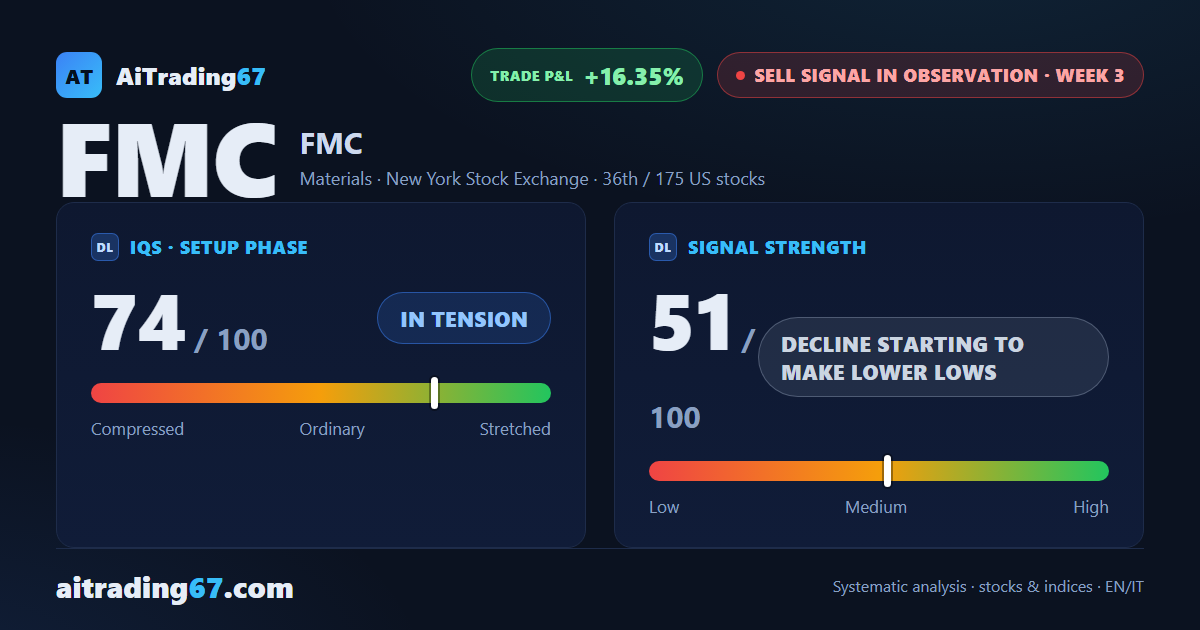
Another 11.9% drop, the 4th losing week in a row, and FMC Corporation prints a fresh 90-week low, confirmed by the weekly close. FMC stock stays in a Sell signal that looked out of push 7 days ago and has now found its stride again, with money flow negative for 5 weeks. The price action stays bearish, but on the daily chart the move is stretched: RSI at 27, oversold, on a highly volatile name. The short is more than 16% in profit; on our technical analysis, opening a new one here is high-risk.
Sell signal in observation
·3rd week from start
·US stocks
·T2
·📅 Earnings · Oct 29
★ See Gold version →
IQS Phase
74
in tension
Signal Strength
51
decline starting to make lower lows
Sizing
STANDARD
Ranking
#36 / 175
US stocks sell signals
Trade P&L %
+16.35%
from signal to date, no stop loss
Rank position
ranks 36th among the 175 sell signals for US stocks in our ranking, with a signal strength of 51 out of 100.
Sector context
SectorMaterials
Benchmark ETFXLB
Sector regimeweak phase
Performanceweekly -1.89% · monthly -7.72%
FMC belongs to the materials sector (reference ETF XLB). The sector is classified weak phase according to our weekly reading.
restricted Platinum content