
Sell signal watch: double bottom near 222
First Solar climbs 1.5% into a double bottom: the Sell signal loses its push
Sell signal watch: double bottom near 222
Our view last week
First Solar is in week 2 of a sell signal, and the week just closed down 6.1%. Signal strength climbs to 86 out of 100: the decline is making lower lows, pace holding, with no sign of exhaustion. The stock ranks 87th among 137 US sell signals, and opening a position is at elevated risk per our model.
This week's summary
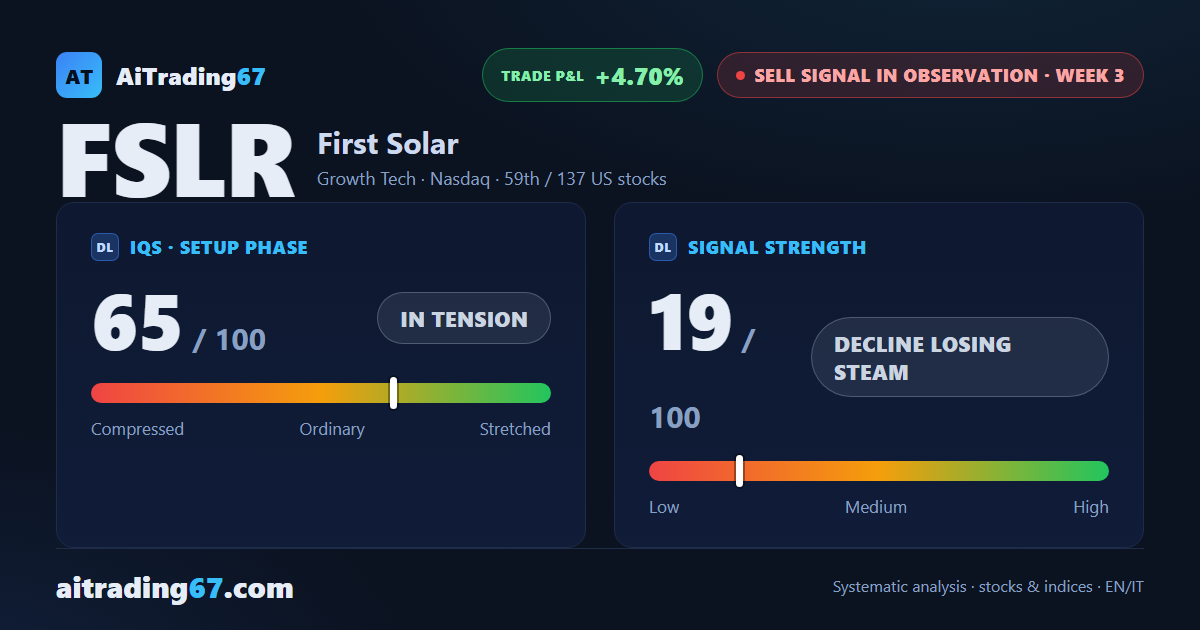
First Solar shares reverse course: after weeks of lower lows, the Sell signal closed the week up 1.5%, with a clean double bottom in the 222 area sparking a 9% intermediate rebound. Signal strength now reads a decline with no fresh downside push, and the IQS stays in tension. The stock sits in 59th place among the 137 US sell signals, with the quality band flagging trading as not recommended and earnings arriving in two weeks.
Sell signal in observation
·3rd week from start
·US stocks
·T2
·📅 Earnings · Jul 23
★ See Gold version →
IQS Phase
65
in tension
Signal Strength
19
decline losing steam
Sizing
MINIMUM
Ranking
#59 / 137
US stocks sell signals
Trade P&L %
+4.70%
from signal to today
restricted Platinum content