
EN IT

Fastly: decline holds but fades, double bottom in the 16 area to watch

Fastly weekly technical analysis — week 10 of a sell signal, trade setup still bearish but showing fading momentum. Double bottom in the 16 area and CMF turning positive: key signals to watch for any shift in trend.

Fastly: decline holds but fades, double bottom in the 16 area to watch
Fastly · Sell signal at week 10
Fastly: decline holds but fades, double bottom in the 16 area to watch
June 26, 2026
Fastly · Sell signal at week 10
In Summary
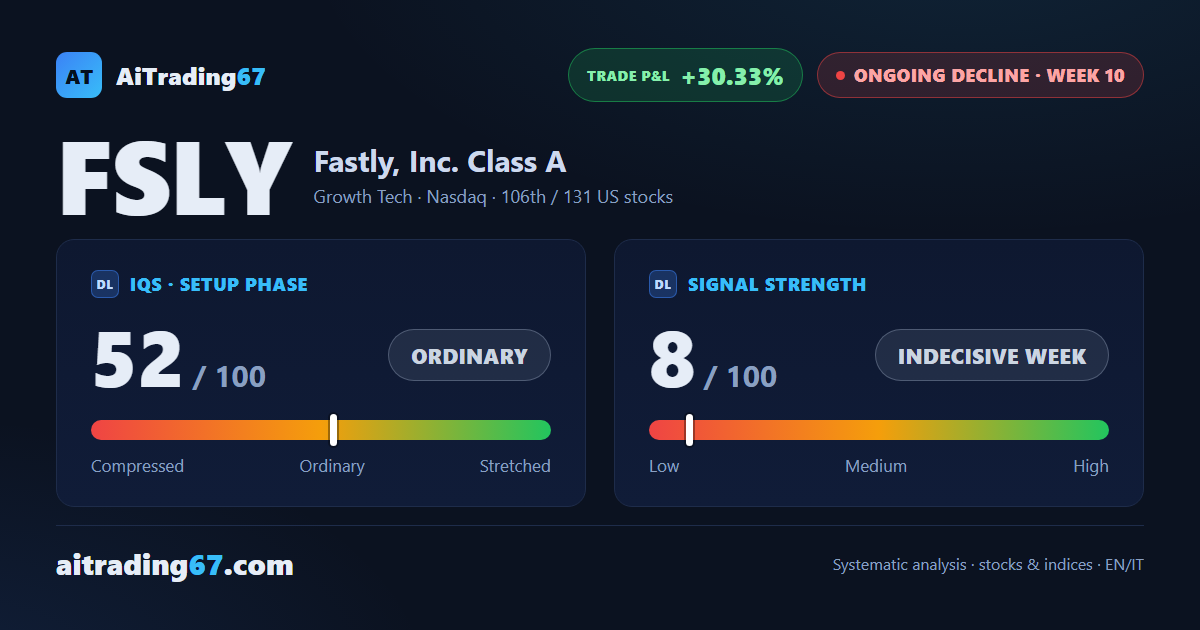
Fastly, Inc. is at week 10 of its sell signal, with the trade up 30% from inception. The bearish trend holds directionally, but the past few weeks show signs of fading momentum: MACD converging toward its signal line and CMF turning positive. The double bottom forming in the 16 area on the daily chart is the key level to watch this week.
Ongoing decline ·10th week from start ·US stocks ·T2 ★ See Gold version →
IQS Phase
52
ordinary
Signal Strength
8
indecisive week
Sizing
MINIMUM
Ranking
#106 / 131
US stocks
Trade P&L %
+30.33%
from signal to today
Chart · Weekly — EMA50 · MACD · VWAP
Weekly chart · EMA50 · MACD · VWAP · Source: TradingView
How to read this pageA visual guide to the post, card by card
The full analysis, operating plan and detailed levels on this asset are reserved for clients ★ PLATINUM
restricted Platinum content
Share WhatsApp Telegram Gmail LinkedIn