
US tech ETF, 13th week of trade management
FTEC drops 4.2% as the buy signal cools after a month-long slowdown
US tech ETF, 13th week of trade management
Our view last week
The US tech sector found its footing again: after a clean double bottom near 266, FTEC bounced 3% this week, with buyers decisively back in control - 97% of volume on the buy side. The trade now sits at +17.4% since entry, but underneath, momentum has kept cooling for a month, and price is boxed between the 281 and 283 areas.
This week's summary
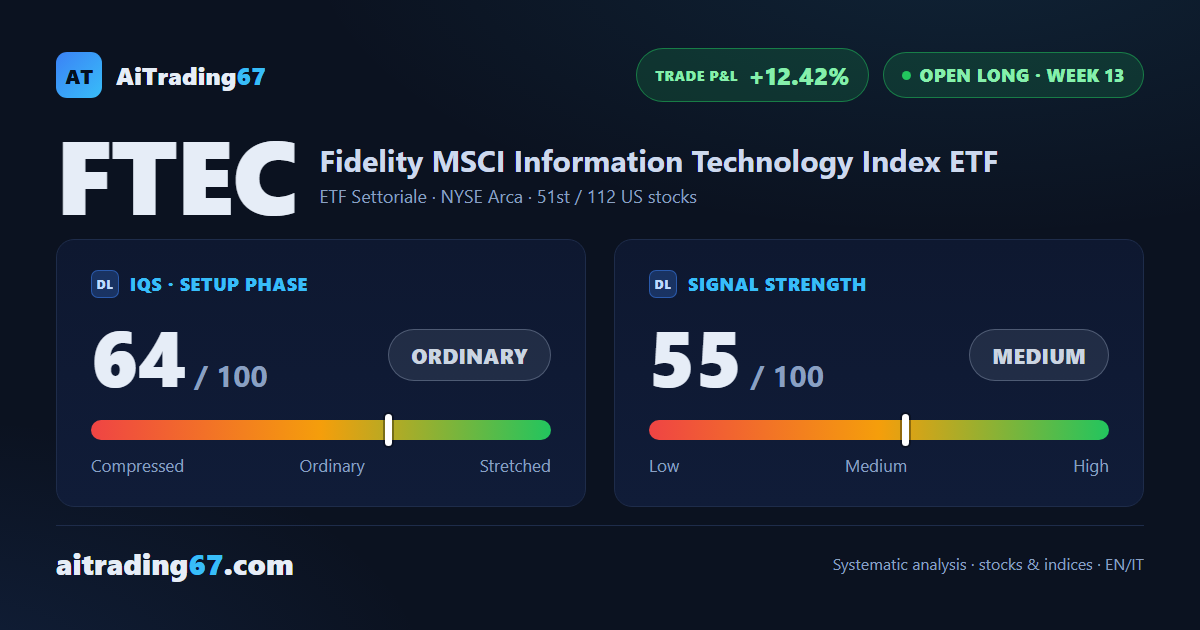
FTEC, the US technology sector ETF, gave back 4.2% this week: after last week's 3% bounce, with buyers holding 97% of volume, sellers are now in control at 68%. Momentum, which has been cooling for a month, has now tipped downward, and price is boxed between the 20-day average, in the 277 area, and the daily pivot, in the 269 area. The long trade keeps gaining, up 12.4% since entry.
IQS Phase
64
ordinary
Signal Strength
55
medium
Sizing
STANDARD
Ranking
#51 / 112
US stocks in progress
Trade P&L %
+12.42%
from signal to today
restricted Platinum content