
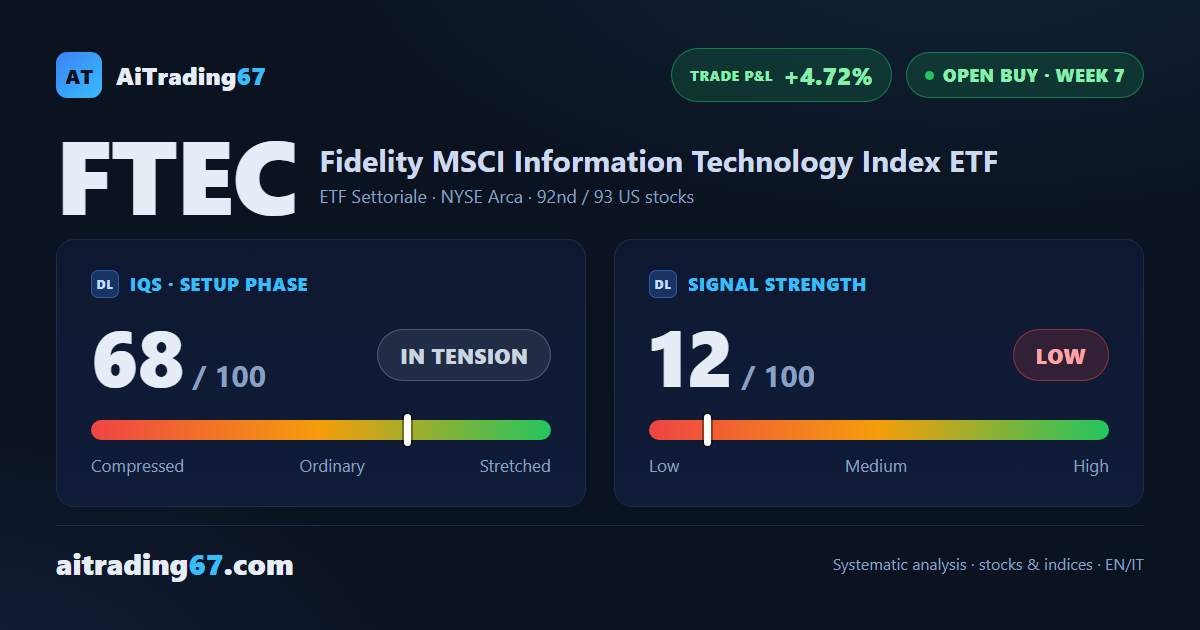
US technology ETF · Open buy, week 7
FTEC gains 1.7% to a new all-time high while signal strength stays low
Our view last week
The resistance in the 292 area that held FTEC back last week has given way: up 3.2%, the Fidelity US technology sector ETF closes 0.3% below its all-time high, with buyers in the majority for 5 weeks and money flow positive for 8. FTEC technical analysis shows clean weekly price action on this basket of US tech stocks; the thing to watch is signal strength, low and still fading in week 6 of the buy signal.
This week's summary
FTEC, the Fidelity US technology sector ETF, printed a new all-time high and closed above the old one, up 1.7% on the week. The 292 area resistance cleared 7 days ago is now well behind, and the weekly MACD is back above its Signal line after 6 weeks. FTEC technical analysis shows clean price action on this basket of tech stocks, one of our weekly buy signals still open; the weak spot is a signal strength that stays low and flat, with the weekly RSI up at 70.
IQS Phase
68
in tension
Signal Strength
12
low · fading
Sizing
MINIMUM
Ranking
#92 / 93
US stocks in progress
Trade P&L %
+4.72%
from signal to date, no stop loss
FTEC Technology US weekly chart — EMA50 · MACD · VWAP
Weekly chart · EMA50 · MACD · VWAP · Source: TradingView
Rank position
ranks 92nd among the 93 Longs already running for US stocks in our ranking, with a signal strength of 12 out of 100.
Sector context
SectorETF Settoriale
Benchmark ETFXLK
Sector regimein strong phase
Performanceweekly +1.80% · monthly +8.83%
FTEC belongs to the etf settoriale sector (reference ETF XLK). The sector is classified in strong phase according to our weekly reading.
restricted Platinum content