
Buy signal, week 11: RSI flags extreme overbought
Fortinet climbs another 2.6% as weekly RSI flags deep overbought
Buy signal, week 11: RSI flags extreme overbought
Our view last week
Fortinet shares are hugging their highs, with the weekly RSI up at 83.9 — firmly overbought — while the MACD starts to roll over: the trend still burns, with the ADX climbing, but the first signs of fatigue are showing. In this week's technical analysis the buy signal tops the board, first among 129 US Longs with a signal strength of 87 out of 100, and the trade is running at +82.5% since entry.
This week's summary
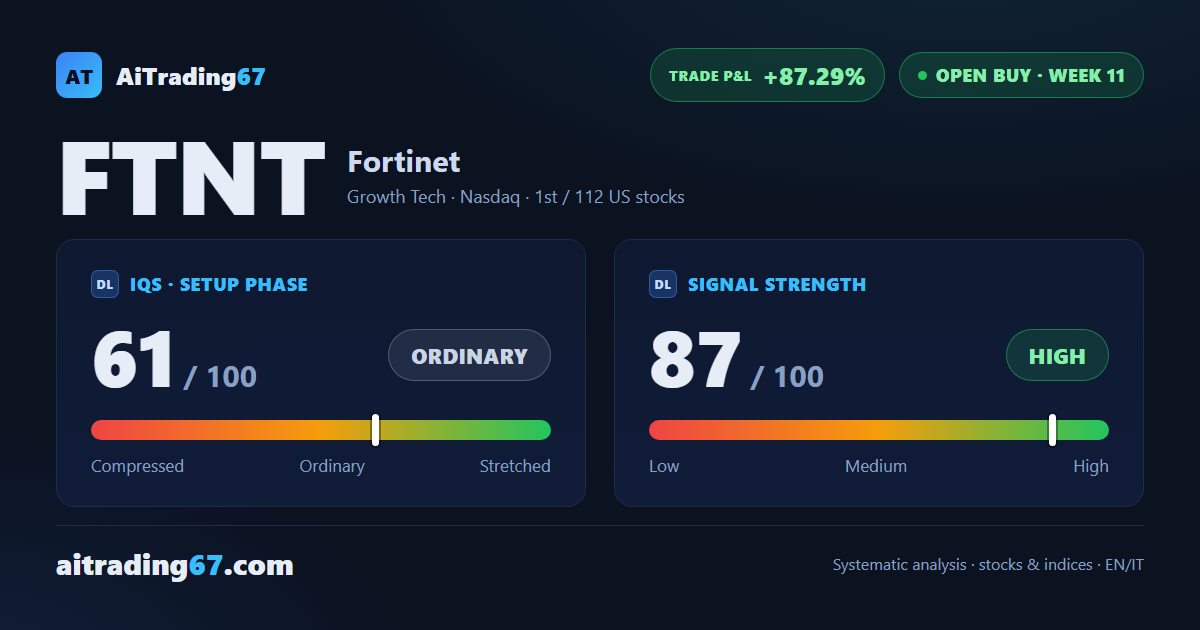
Fortinet stays the strongest buy signal in the US book, but the week leaves a warning behind: the weekly RSI climbs to 84.9, deep overbought, and the MACD is starting to roll over. In this week's technical analysis the trade adds another 2.6% and rises to +87.29% since entry, first among the 112 US buy signals still open. The stock is hugging its all-time highs, with little room left before the next historical resistance.
IQS Phase
61
ordinary
Signal Strength
87
high · wide move
Sizing
FULL
Ranking
#1 / 112
US stocks in progress
Trade P&L %
+87.29%
from signal to today
restricted Platinum content