
Fortis, double bottom within reach of all-time highs
Fortis closes flat (+0.1%) as the buy signal holds near record highs
Fortis, double bottom within reach of all-time highs
Our view last week
Fortis closes the week boxed into a very tight range, wedged between the daily upper Bollinger Band and the daily pivot point, after a double bottom in the 55 area produced a 6% rebound. The signal, a stalled sell for sixteen weeks until seven days ago, has flipped: a new Buy signal has just kicked in, but right against the stock's all-time highs and with signal strength at just 28 out of 100. This week's technical analysis flags trading as not recommended, with the utilities sector still weak.
This week's summary
Fortis carves out a double bottom in the 56 area with a 4% rebound and moves back within reach of its all-time highs, just 0.6% away. The week closes almost flat, but the weekly picture stays bullish: RSI at 61.7, MACD improving, and every structural moving average aligned. The buy signal that fired seven days ago is holding, even as the stock pushes against resistance already tested multiple times.
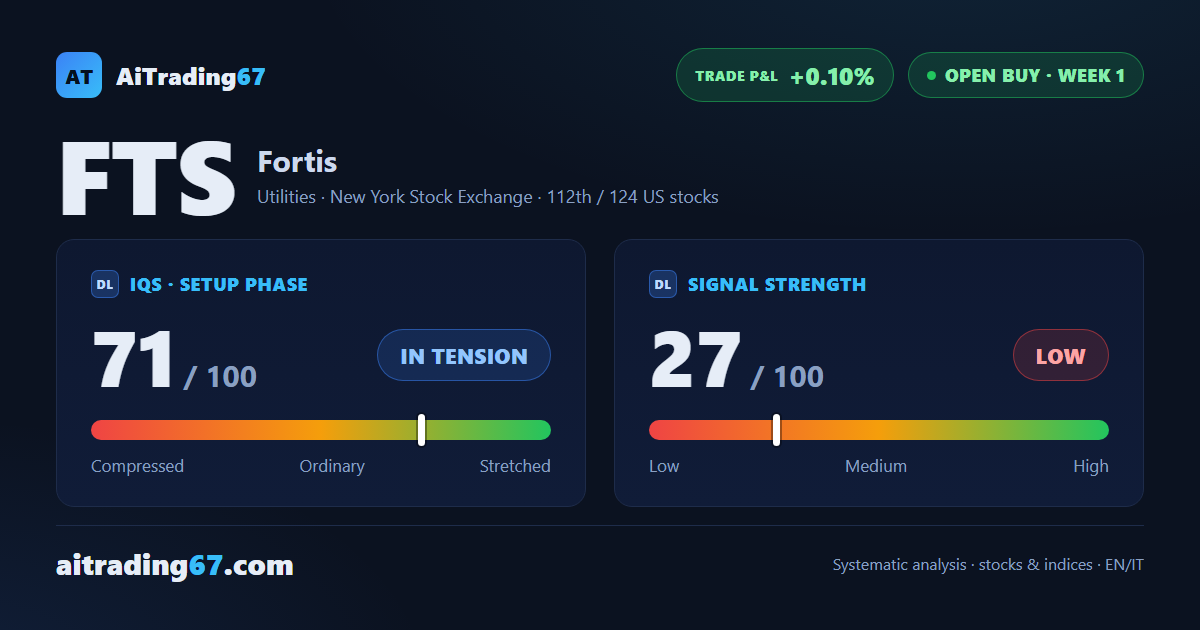
IQS Phase
71
in tension
Signal Strength
27
low · fading
Sizing
MINIMUM
Ranking
#112 / 124
US stocks in progress
Trade P&L %
+0.10%
from signal to today
Rank position
ranks 112th among the 124 Longs already running for US stocks in our ranking, with a signal strength of 27 out of 100.
Sector context
SectorUtilities
Benchmark ETFXLU
Sector regimein positive regime
Performanceweekly +2.48% · monthly +1.65%
FTS belongs to the utilities sector (reference ETF XLU). The sector is classified in positive regime according to our weekly reading.
restricted Platinum content