
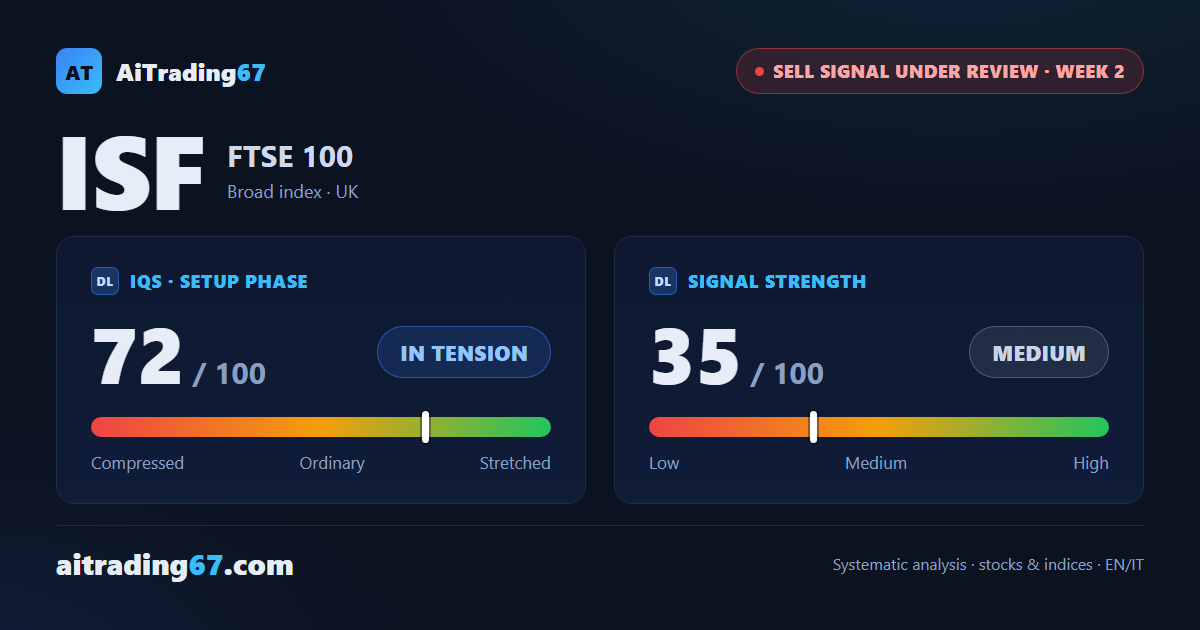
FTSE 100 · Sell Signal under review, week 2 of 3
ISF ETF: the FTSE 100 prints a new 30-day low as the Sell Signal stays under review
Our view last week
ISF, the FTSE 100 ETF, has climbed back a few tenths above the 20-week average and the Kumo ceiling, the area it gave up in the week the Sell Signal fired. Money is heading the other way: weekly money flow has dropped below zero after 10 weeks in positive ground. With Signal Strength at 9 out of 100, technical analysis finds a trade setup at a standstill, and price action trading boxed in between the monthly low in the 1035 area and the daily averages in the 1046 area.
This week's summary
ISF, the FTSE 100 ETF, hands back last week's recovery: price slips back below the 20-week average and prints a new 30-day low in the 1011 area, confirmed by the weekly close. Technical analysis shows the MACD histogram falling for 6 weeks and money flow negative for a 2nd. The Sell Signal of 18 September stays under review, down 1.7% against a -6% threshold: weak price action trading, and a trade setup still waiting for confirmation.
IQS Phase
72
in tension
Signal Strength
35
medium · weak
ATH distance
12.79%
12.79%
KPI 4
0/3
FTSE 100 (ISF) weekly chart — EMA50 · MACD · VWAP
Weekly chart · EMA50 · MACD · VWAP · Source: TradingView
restricted Platinum content