
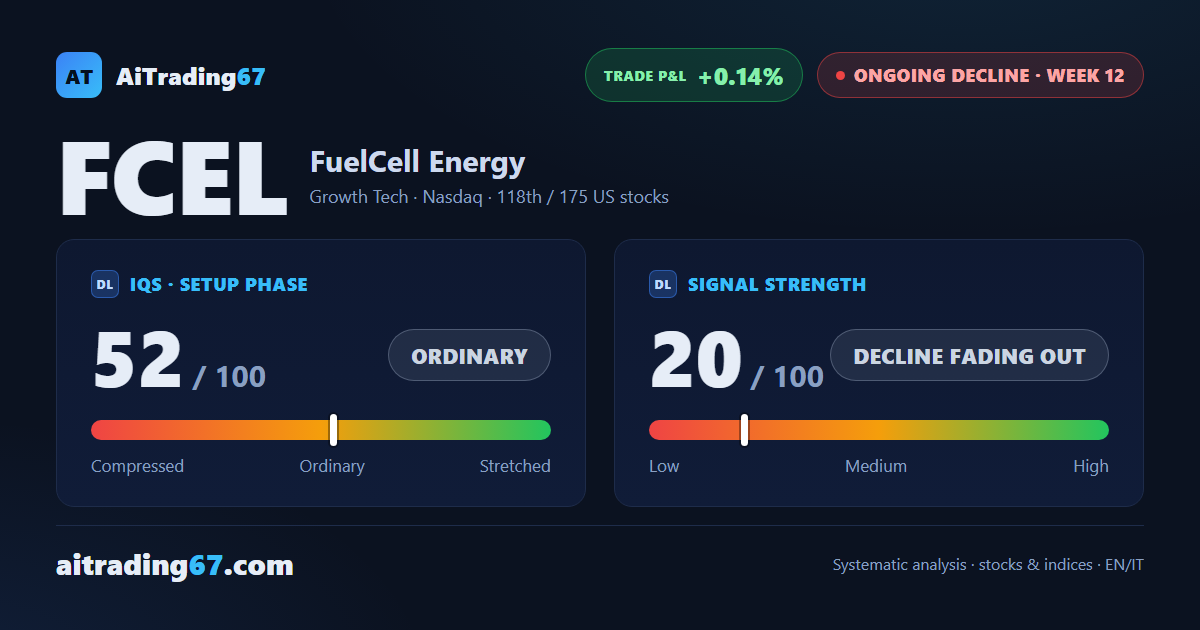
Sell signal, week 12 · US stocks
FuelCell Energy jumps 12% and reclaims its averages, wiping out the short's gain
Our view last week
A week after a 14% bounce, FuelCell Energy gives back 8.9% and sellers retake the weekly candle with 79% of the volume. FuelCell Energy stock stalls below its 7-day high, in the 18.9 area, and is squeezed again between the 16.5 and 16.6 areas. Price action still reads distribution, and the short, in week 11 of this swing trading setup, is 10.8% in profit.
This week's summary
A week ago it was down 8.9%; this week FuelCell Energy jumps 12% and reclaims in one go the band of averages between the 17.7 and 18.3 areas. FuelCell Energy stock still sits below its 7-day high, in the 18.5 area, on contracting volume. For the short, 10.8% in profit a week ago, the cushion is almost gone: the price action, a rebound off the 20-day average, is what this swing trading setup now turns on.
IQS Phase
52
ordinary
Signal Strength
20
decline fading out
Sizing
MINIMUM
Ranking
#118 / 175
US stocks
Trade P&L %
+0.14%
from signal to date, no stop loss
FuelCell Energy (FCEL) weekly chart — EMA50 · MACD · VWAP
Weekly chart · EMA50 · MACD · VWAP · Source: TradingView
Rank position
ranks 118th among the 175 sell signals for US stocks in our ranking, with a signal strength of 20 out of 100.
Sector context
SectorGrowth Tech
Benchmark ETFXLK
Sector regimein strong phase
Performanceweekly +1.80% · monthly +8.83%
FCEL belongs to the growth tech sector (reference ETF XLK). The sector is classified in strong phase according to our weekly reading.
restricted Platinum content