
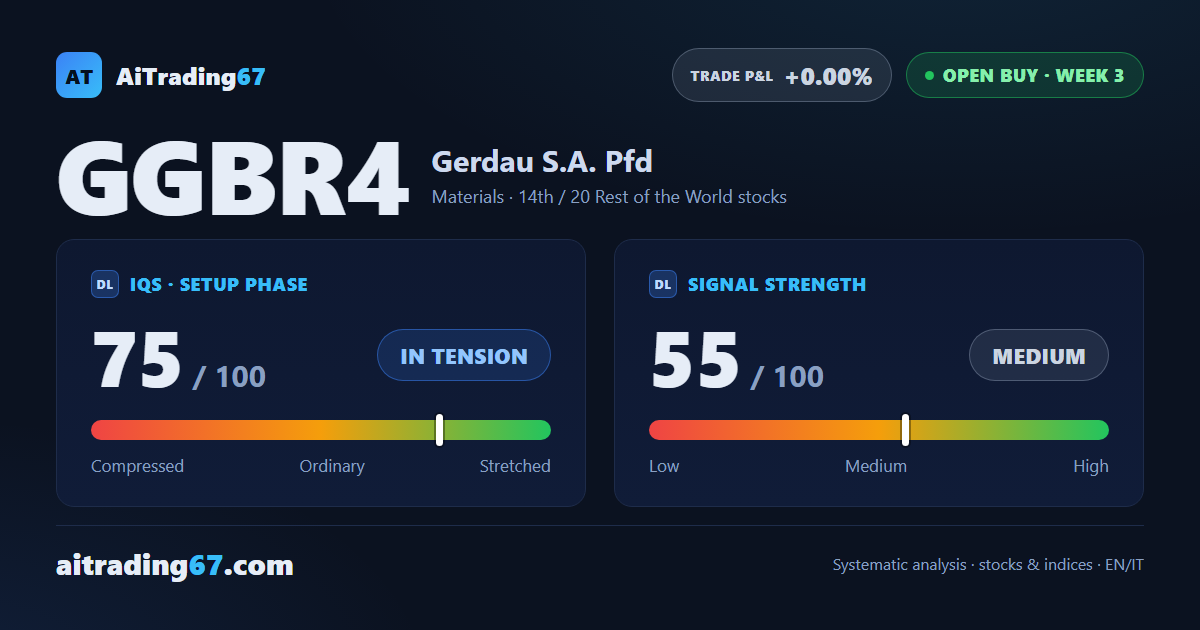
Open buy · week 3
Gerdau climbs 4.4% off its 20-day average and presses its highs again
Our view last week
Gerdau slipped 1.4% on the week and dropped onto its 20-day average, the very pullback entry zone flagged 7 days ago. Sellers still lead the weekly bar, but the last session saw 94% of volume on the buy side. The technical analysis of Gerdau stock stays constructive: the buy signal holds, with price above the 50-week average and the weekly Kumo. For swing trading, the trade setup now hinges on the price action of the coming sessions.
This week's summary
The bounce came right where it was expected: off the 20-day average it had dropped onto 7 days ago, Gerdau gained 4.4% and is back within reach of its 90-week highs. The technical analysis of Gerdau stock improves: the weekly MACD is rising again and money flow stays positive. The buy signal holds, but the highs are heavily contested and the ADX has been falling for 7 weeks: for swing trading, the trade setup hinges on price action under that ceiling.
Open BUY
·3rd week from start
·Rest of the World stocks
·T1
·📅 Earnings · Oct 26
★ See Gold version →
IQS Phase
75
in tension
Signal Strength
55
medium
Sizing
STANDARD
Ranking
#14 / 20
Rest of the World stocks in progress
Trade P&L %
+0.00%
from signal to date, no stop loss
Gerdau (GGBR4) weekly chart — EMA50 · MACD · VWAP
Weekly chart · EMA50 · MACD · VWAP · Source: TradingView
Rank position
ranks 14th among the 20 Longs already running for titoli resto del mondo in our ranking, with a signal strength of 55 out of 100.
Sector context
SectorMaterials
Benchmark ETFXLB
Sector regimeweak phase
Performanceweekly -1.89% · monthly -7.72%
GGBR4 belongs to the materials sector (reference ETF XLB). The sector is classified weak phase according to our weekly reading.
restricted Platinum content