
Rest of the World stocks · Sell signal
Gerdau S.A. Pfd: week 1 of a sell signal — trading not recommended
Rest of the World stocks · Sell signal
In Summary
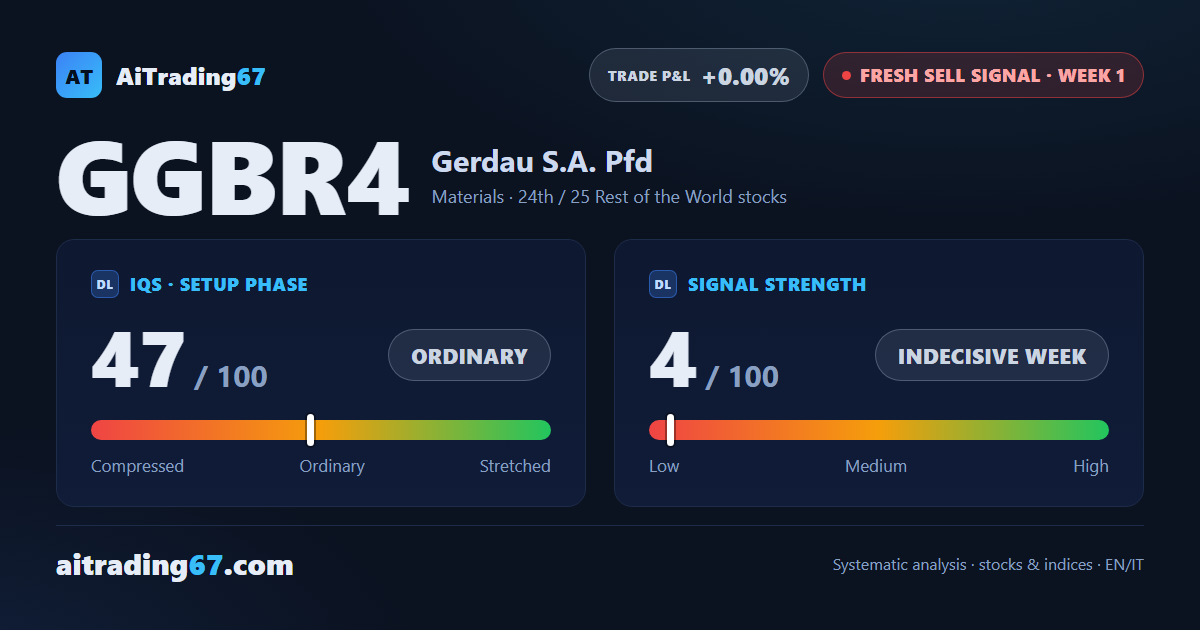
A fresh sell signal on Gerdau S.A. Pfd — week 1, but conditions give pause. The setup quality indicator (IQS) sits at 47 out of 100 in ordinary phase, and the stock ranks 24th among the 25 sell signals in the Rest of the World category. Our model flags trading as not recommended: opening a new short position here carries elevated risk.
IQS Phase
47
ordinary
Signal Strength
4
indecisive week
Sizing
MINIMUM
Ranking
#24 / 25
New rest of the world stocks
Trade P&L %
+0.00%
from signal to today
restricted Platinum content
Rank position
ranks 24th among the 25 sell signals for titoli resto del mondo in our ranking, with a signal strength of 47 out of 100.
Sector context
SectorMaterials
Benchmark ETFXLB
Sector regimeweak phase
Performance1W -0.41% · 1M +0.82%
GGBR4 belongs to the materials sector (reference ETF XLB). The sector is classified weak phase according to our weekly reading.
Confirmation week
confirmation week still in progress
confirmation week action still to be determined
Setup qualityTrading not recommended
Opening at elevated risk per our model; the asset continues to be analyzed week by week.
DLPrice Action · Last 4 weeks
struttura neutra (2 segnali di attenzione su 11 componenti)
Score60/ 100
Constructive weekly reading but with two attention signals: the structure deserves close monitoring.
⚠ Attention signals (2)
PA7 · body conviction building but last bar weakPA9 · sellers slightly prevalent in the last bar
Daily pattern
lower highsModerate
Sequence of 3 lower highs in the recent daily bars, from 25 to 22.
Reference levels: 24.65 · 21.88
DLIQS · Setup phase
47/ 100
ordinary
3-week slope: coming soon
DLSignal Strength4 / 100
4/ 100
Lowindecisive week
DLNo-Trade Zone
No-Trade Zone · operational range
Zone shaded by prevailing regime
close
16.39
27.83
20.77
23.45
DLDistance from all-time highs0.00%
71/ 100
Ample headroom
Distance from ATH: 0.00% · Tests on highs (last 10w): 0
DLSupport & Resistance
Resistances
21.76Week20-week moving averagerejected 2× · 22/06 · broken 2× · 08/06+1.58%
21.78Day100-day moving averagerejected 2× · 22/06 · broken 2× · 08/06+1.68%
22.46Day50-day moving averagerejected 2× · 22/06 · broken 2× · 08/06+4.86%
22.49Day20-day moving averagerejected 4× · 22/06 · broken 2× · 08/06+5.00%
22.82Day7-day highrejected 3× · 15/06+6.54%
22.85Daydaily Bollinger Band midlinerejected 5× · 15/06 · broken 2× · 08/06+6.69%
Supports
21.16Day7-day lowrejected 2× · 22/06-1.21%
20.83Daydaily lower Bollinger Bandrejected 4× · 22/06 · broken 2× · 15/06-2.76%
20.70Daydaily Kumo floorrejected 3× · 22/06 · broken 1× · 30/03-3.36%
20.66Day200-day moving averagerejected 2× · 22/06 · broken 1× · 23/03-3.57%
20.31Week50-week moving averagerejected 1× · 06/04 · broken 1× · 23/03-5.17%
19.47Week100-week moving averagerejected 2× · 30/03 · broken 1× · 23/03-9.11%
Operational plan · summary
Gerdau S.A. Pfd enters week 1 of a sell signal against a bearish intermediate weekly structure: 3 of the 4 key moving averages are aligned to the downside and the MACD has crossed bearish with a declining histogram. That structural backdrop is the guide — not the signal strength, which stands at 4 out of 100 and reflects an indecisive week, a minimal decline. That reading does not mean pressure is absent: CMF remains in distribution, the −DI leads the +DI by nearly 10 points, and the daily chart shows a sequence of 3 lower highs from the 25 area down toward the 22 area — a slow but orderly descent in price action. The IQS at 47 places the setup in an ordinary phase, with no directional tension in either direction, and the stock sits 24th out of 25 in its category. The structural constraint is clear: the price is still 12.3% above the 200-week moving average and range-trapped. Our model flags trading as not recommended, and discipline points to holding off on new short positions — waiting for the confirmation week outcome is the right call before any move.
Operational levelsTrade P&L +0.00%Opened June 19, 2026
SHORT
Entry
20.77
SL1
22.52
+8.43%
SL2
22.81
+9.82%
TP1
19.09
8.09%
TP2
18.37
11.55%
LONG (alternative scenario)
Entry
23.45
SL1
21.70
-7.46%
SL2
21.40
-8.74%
TP1
25.27
7.78%
TP2
25.78
9.96%
Legend of recurring terms click to expand
IQS PhaseSetup Quality Indicator (0-100): descriptor of the asset's phase relative to its volatility norm. Toward 0 = compressed/accumulation · ~50 = ordinary · toward 100 = stretched/mature. Descriptive, not predictive.
Signal StrengthCalibrated 0-100 indicator, re-modulated weekly. For buy signals it is the probability that the weekly signal reaches the first target without hitting the Stop Loss: high value = compelling bullish scenario. For sell signals it measures the amplitude of the signal week's drop: high value = very sharp drop, which may signal exhaustion rather than continuation.
Setup qualitySetup grade at trade opening. Full open = aligned conditions · Selective open = limited constraints · Operation not advised = the model flags elevated risk at entry · Watch/Skip = not operational. The asset continues to be analysed weekly anyway.
SizingCapital allocation relative to the standard budget per position. Full = 100% · Standard = 75% · Reduced = 50% · Minimum = 25%. Modulated by Signal Strength and setup quality flags.
Rank positionOrdering by Signal Strength inside the category × state pair (US Stocks or EU-UK Stocks · Open buys or Sell signals). Helps compare the current position with the others alive in the same category.
Inversion PointWeekly structural level fixing the Stop Loss reference. For a buy signal it is below entry (giving up that level invalidates the bullish reading); for a sell signal it is above entry (a breakthrough invalidates the bearish reading).
No-Trade ZonePrice band between resistance below and support above where entry is not immediately operational. When the NTZ is active, trading is suspended inside the zone; entries become valid above the upper extreme (long) or below the lower extreme (short).
Breakeven stopOperational SL stage for active buy trades: after the first-week confirmation and price advance, the stop is moved to the entry level and trade risk is zeroed out. The structural Stop Loss remains as a long-term reference.
6/8/10-week windowsThree statistical active-management moments on stock buy trades, derived from our backtest. At weeks 6, 8 and 10 trimming 10%, 20% and 30% of the position is suggested; the residual capital (the remaining 40%, untrimmed) can be kept and left to run until the inversion, with a trailing stop on the Inversion Point. Suggestions, not automatic system events.
Statistical TPs / Time exitThe TPs are statistical time+value targets: they estimate where price would be at a given week if the trade ran at average speed (ATR), and decay toward entry at the gate. The real price at the target week can be much higher (strong trend) or never reach them (weak trend). Time exit is the actual gain (entry→close of the gate week): it is why we manage by time — trimming the planned share at the set week often captures a far larger margin than the mathematical TP.
Reinforced tradeQualification of the buy trade when the confirmation week candle closes higher than the signal week. The system recognises the setup as confirmed by the price reaction.
Structural alertsPrice conditions the system considers relevant for setup qualification. Examples: above weekly EMA200 (stock far from a structural bearish framework, making a new short less safe); range trapped (stock trapped in a prolonged horizontal range).
Entry triggerType of event that operationally opens the position: breakout = breach of a key level (7-session high for a long, 7-session low for a short); pullback = pullback to the pivot or 20-day moving average after a first move in the signal direction.
Distance from highsPercentage distance from the all-time high (ATH) and frequency of tests on highs over the last 10 weeks. Close to ATH means limited running room; wide distance means room before the first significant ceiling.
Support & ResistanceThe technical levels above (resistances) and below (supports) price: moving averages, Bollinger bands, Ichimoku cloud (Kumo), historical highs and lows. Each level shows recent tests — how many times over the last ~5 months price reached it and was rejected (grazed, clean touch or decisive rejection) or broke through it (breakout/breakdown), with the date of the latest episode. More rejections = a more solid wall; a recent breakthrough = the wall has fallen.
IQS Slope (3 weeks)The direction of the IQS Phase over the last three weeks: whether the setup's tension is rising, falling or staying flat. It helps tell whether the asset is approaching a stretched/mature phase or unwinding, beyond the point-in-time IQS value.
Trade start dateThe week the current signal opened. Together with the percentage gain since start, it shows how long the trade has been running and where it sits along the management path (scale-out windows, breakeven stop).
Reading guideHow to read this page →
Disclaimer — The content on this page is published for educational and informational purposes and represents the author's personal opinion and technical analysis. It is not financial advice, a solicitation to invest, or personalised recommendation. Trading financial instruments involves significant risks and may result in the loss of all or part of the invested capital. Every operational decision is the sole responsibility of the user, who acknowledges acting in full autonomy and full awareness of risk.
Copyright — All text, analytical methodology and proprietary indicators (IQS Phase, Signal Strength, NTZ, Inversion Point, Entry Protocol, Ranker, Exit Gate) published on aitrading67.com are © Fabio Gentili. Reproduction, in whole or in part, in any form and for any purpose, is prohibited without the author's written permission.