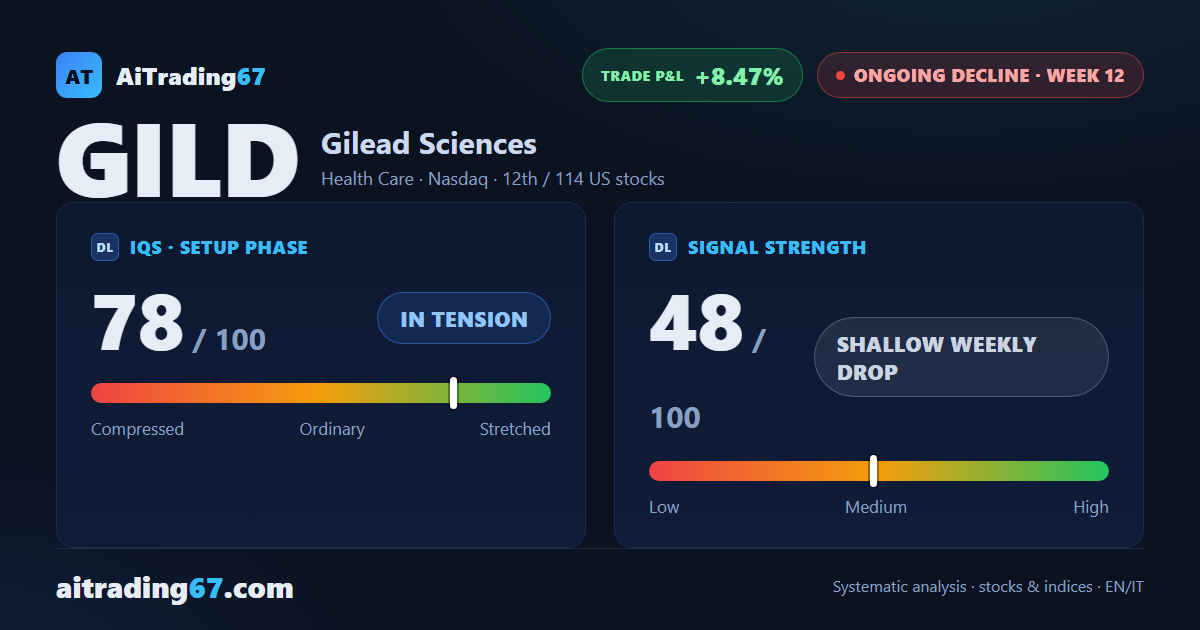
Gilead Sciences · 12th week of decline
Ongoing decline, but the daily chart sends a warning
Gilead Sciences · 12th week of decline
In Summary
Gilead Sciences is at week 12 of a sell signal, with a gain of 8.47% from entry. The decline continues in the expected direction, but this week's momentum has slowed and a double bottom pattern has formed in the 124 area on the daily chart — a technical signal worth monitoring closely in the sessions ahead.
IQS Phase
78
in tension
Signal Strength
48
shallow weekly drop
Sizing
REDUCED
Ranking
#12 / 114
US stocks
Trade P&L %
+8.47%
from signal to today
restricted Platinum content