
Double bottom and fading ADX on the Sell signal
Glencore slips 0.6% and drops to 29th among European sell signals
Double bottom and fading ADX on the Sell signal
Our view last week
Glencore is in week 2 of a sell signal, ranking 7th among the 54 sell signals for European-UK stocks. The week gave back 0.2%, an isolated dip rather than an accelerating decline, and the price sits compressed between the first resistance and the first support. The stock, though, still trades 25.1% above the 200-week moving average: opening a new short here is high risk per our model.
This week's summary
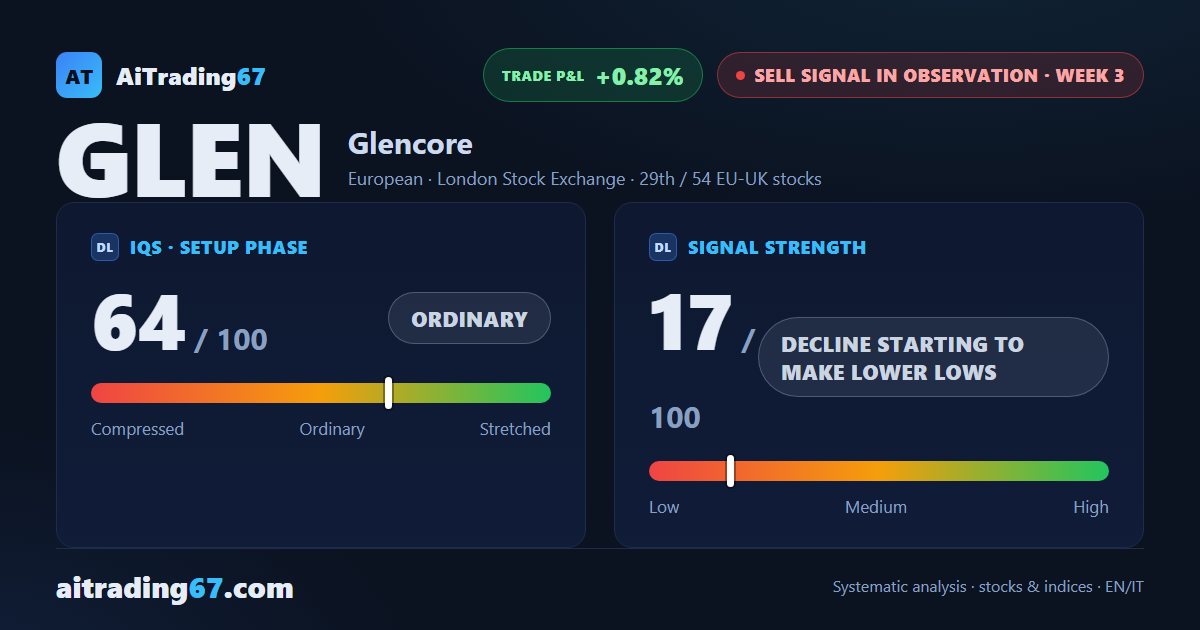
On Glencore's daily chart a double bottom has just formed in the 487 area, with an intermediate 24% rebound putting some air back under the price. The picture has shifted from a week ago: from 7th place, the stock slips to 29th among the 54 European sell signals, with the weekly ADX losing conviction and intraday sellers retreating (61% of volume on the buy side). Glencore stock still trades 24% above its 200-week average: a technical setup worth watching closely.
IQS Phase
64
ordinary
Signal Strength
17
decline starting to make lower lows
Sizing
MINIMUM
Ranking
#29 / 54
EU-UK stocks sell signals
Trade P&L %
+0.82%
from signal to today
restricted Platinum content