
Gold ETF · Sell signal, week 2
GLD drops 3.4% and loses its 50-week average as the lower highs reach 6
Our view last week
GLD, the gold ETF, slipped 1.9% after another rejection below the band of daily moving averages, between the 396 and 400 areas, and the model has turned: a week ago the signal was a buy, now a fresh sell signal fires. GLD technical analysis shows a decline just getting started, with daily price action stuck on 5 lower highs. Setup quality is ordinary and the confirmation week is still open.
This week's summary
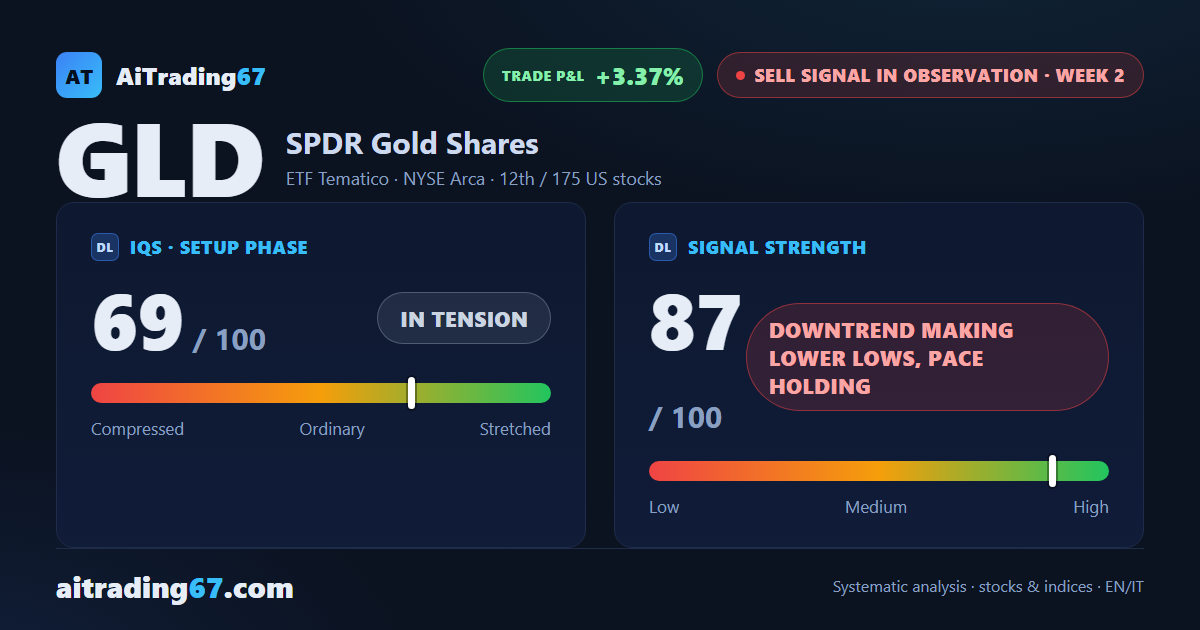
GLD, the gold ETF, fell 3.4% and closed below its 50-week moving average, which was still holding a week ago. Daily price action stretches the run to 6 lower highs, from the 407 area to the 385 area, and the weekly MACD slips below its Signal line. In GLD technical analysis, the Sell signal that fired last week is gathering pace, a decline making lower lows. The price still sits far above its long-term averages, though: opening a short now is high-risk.
IQS Phase
69
in tension
Signal Strength
87
downtrend making lower lows, pace holding
Sizing
STANDARD
Ranking
#12 / 175
US stocks sell signals
Trade P&L %
+3.37%
from signal to date, no stop loss
Gold (GLD) weekly chart — EMA50 · MACD · VWAP
Weekly chart · EMA50 · MACD · VWAP · Source: TradingView
Rank position
ranks 12th among the 175 sell signals for US stocks in our ranking, with a signal strength of 87 out of 100.
Sector context
SectorETF Tematico
Benchmark ETF—
Sector regime
Performanceweekly coming soon · monthly coming soon
GLD belongs to the etf tematico sector (reference ETF ).
restricted Platinum content